
On a per capita basis, the transportation sector energy consumption in 2019 was 86 million Btu, which is a 54% increase from 1950.
Transportation Technologies Office
October 26, 2020On a per capita basis, the transportation sector energy consumption in 2019 was 86 million Btu, which is a 54% increase from 1950 and about the same level as in 1974. The industrial sector, which had the highest energy consumption, decreased 7% from 1950 to 2019 and decreased 36% from its highest point in 1973. The residential and commercial sectors rose 64% and 116%, respectively, from 1950 to 2019.
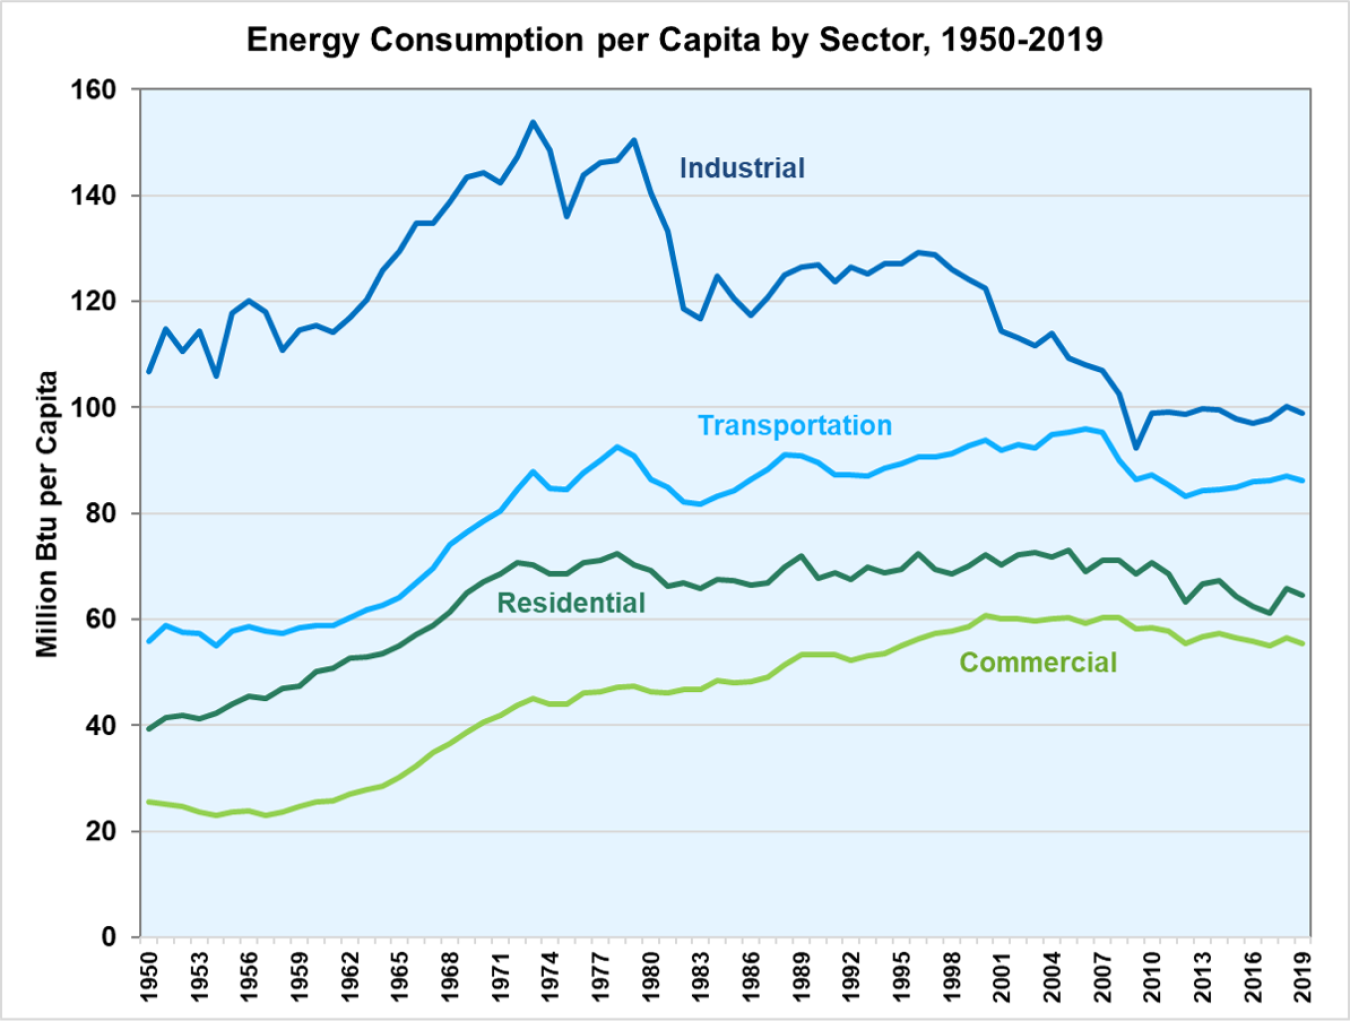
Sources: Energy use -- Energy Information Administration, July 2020 Monthly Energy Review, Table 2.1. Population – Oak Ridge National Laboratory, Transportation Energy Data Book: Edition 38.1, Table 9.1.