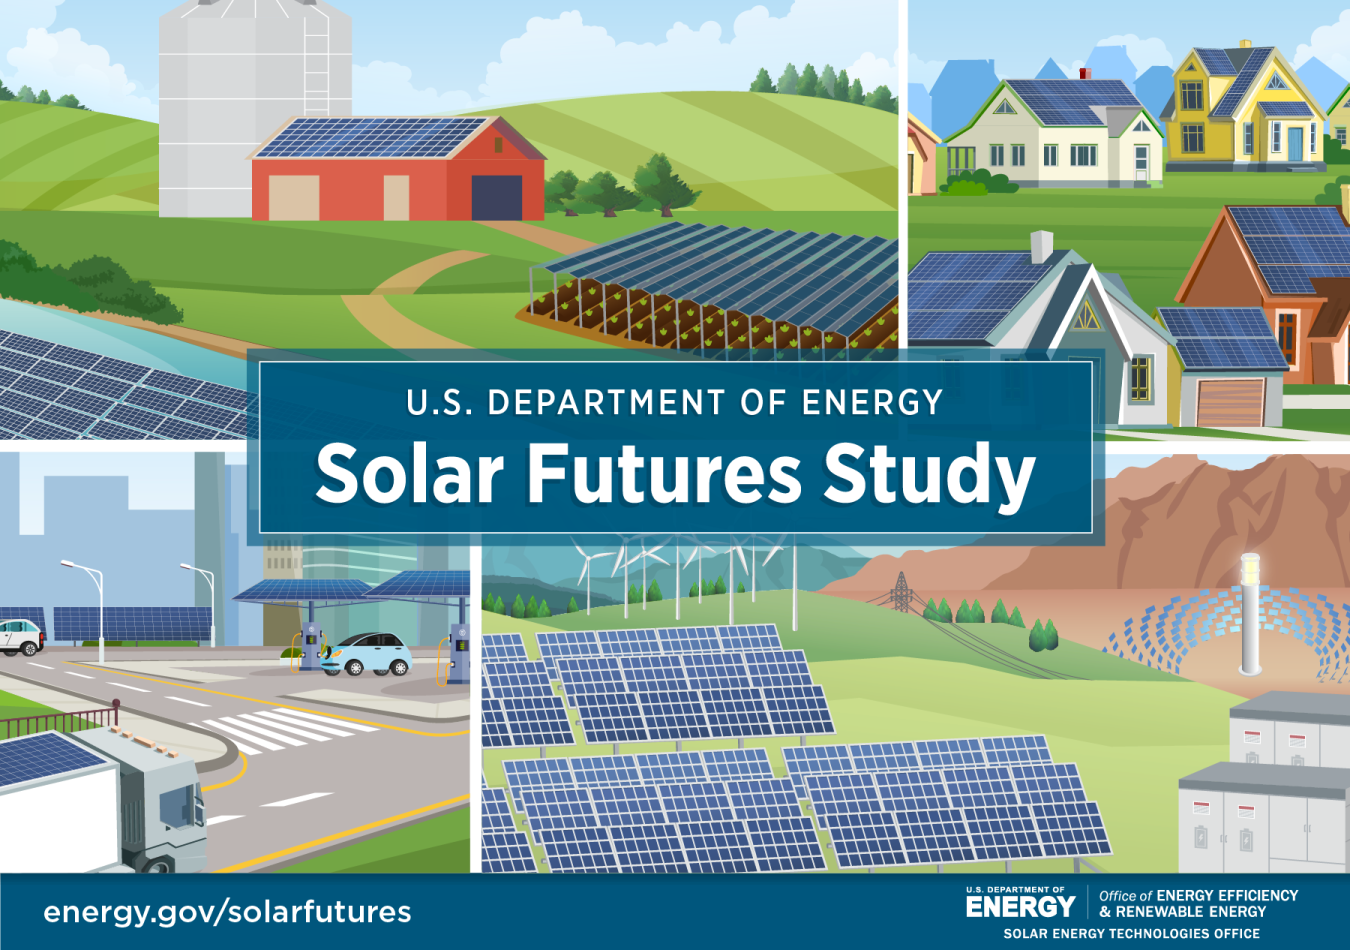
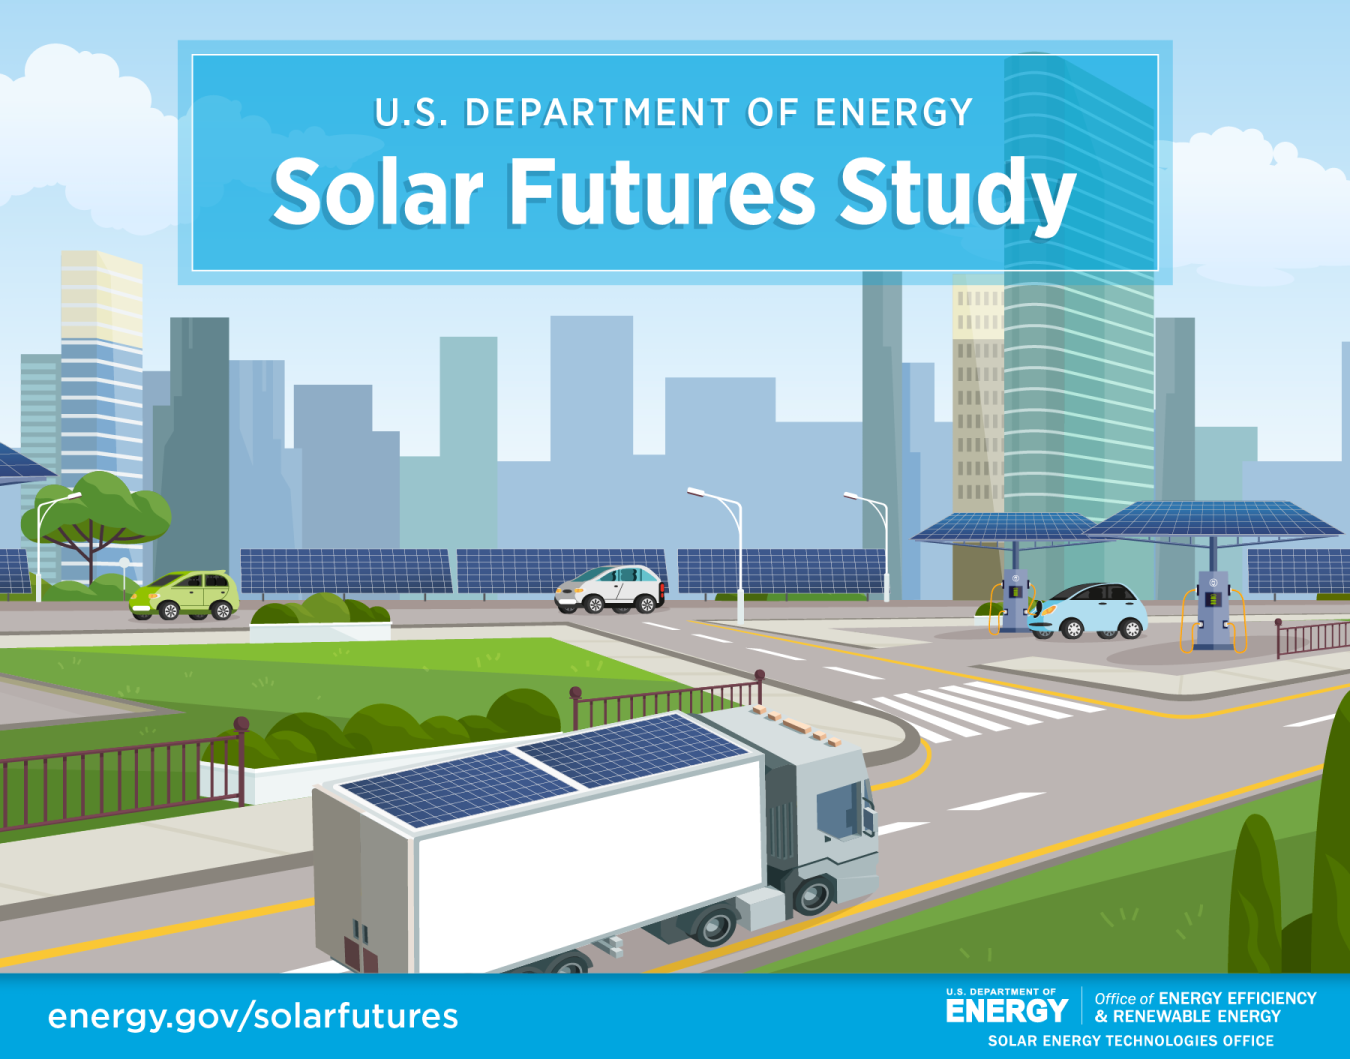
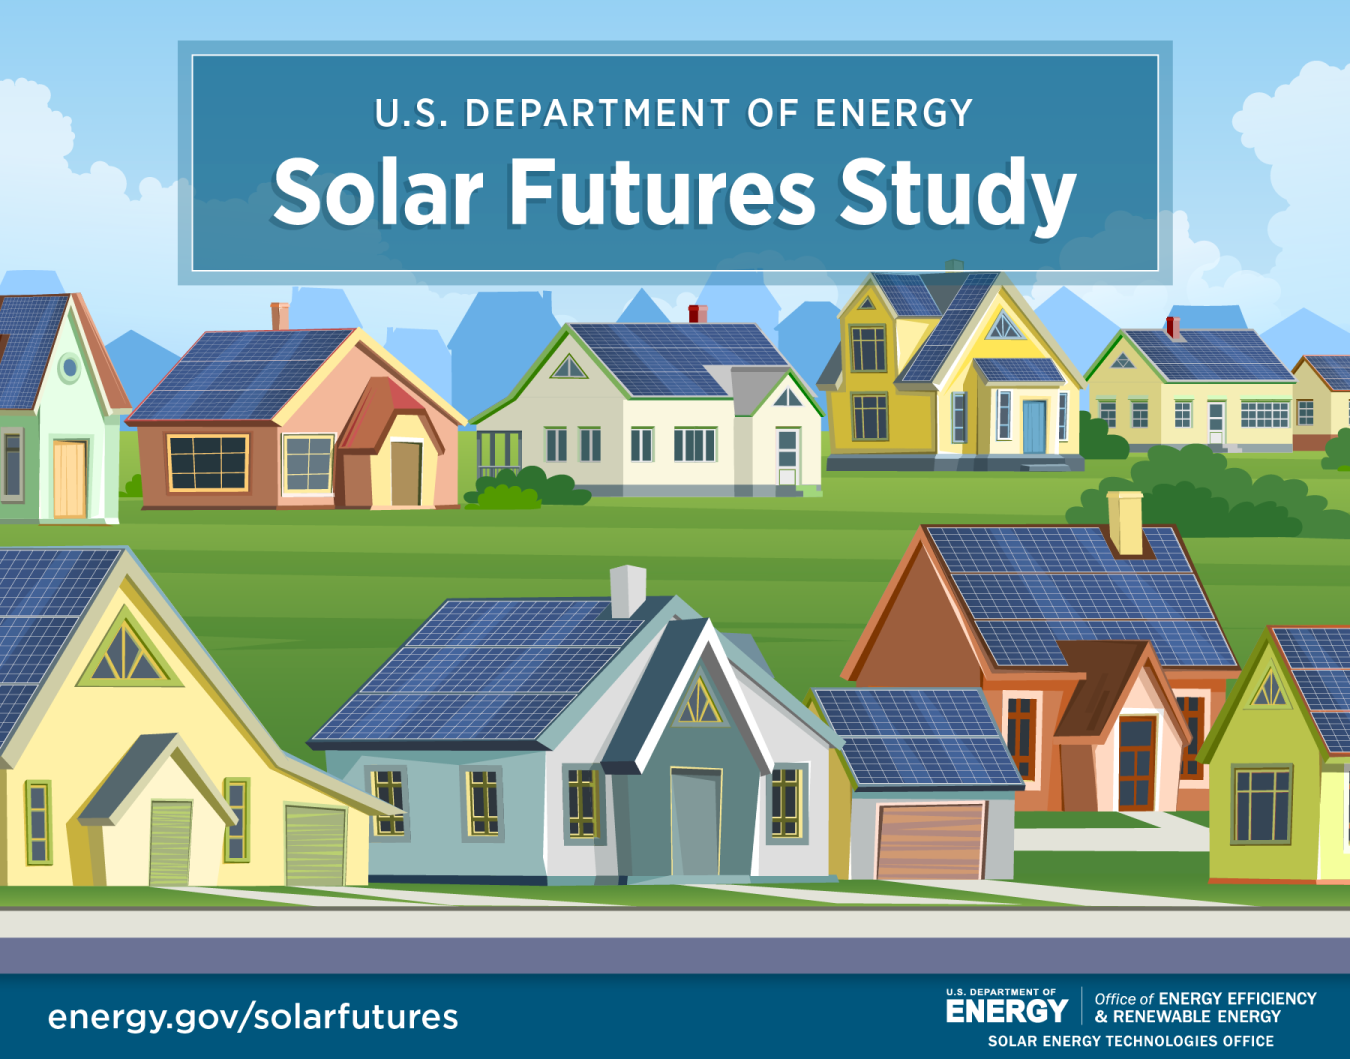
Solar Futures Study Multimedia

Shareable Images

Graphic depicting solar panels in a variety of locations and uses with "Solar Futures Study" written over the top
Graphic depicting solar panels, concentrating solar-thermal power, batteries, and windmills on a landscape backdrop
Graphic depicting solar panels floating on water and suspended over farmland
Graphic depicting solar panels on trucks, electric vehicle charging stations, and buildings
Graphic depicting solar on the rooftops of several neighboring houses
Line chart showing how deployment of solar energy will increase from 2020 - 2050 to achieve a decarbonized grid
Sankey diagrams depicting how the sources of energy in the U.S. electric grid will change from 2020-2050
Graphic comparing the amount of land in the U.S. dedicated to different uses compared to the amount of land needed for solar
Three U.S. maps showing how much solar capacity would increase in each census division in 2020, 2035, and 2050


Interactive Diagrams

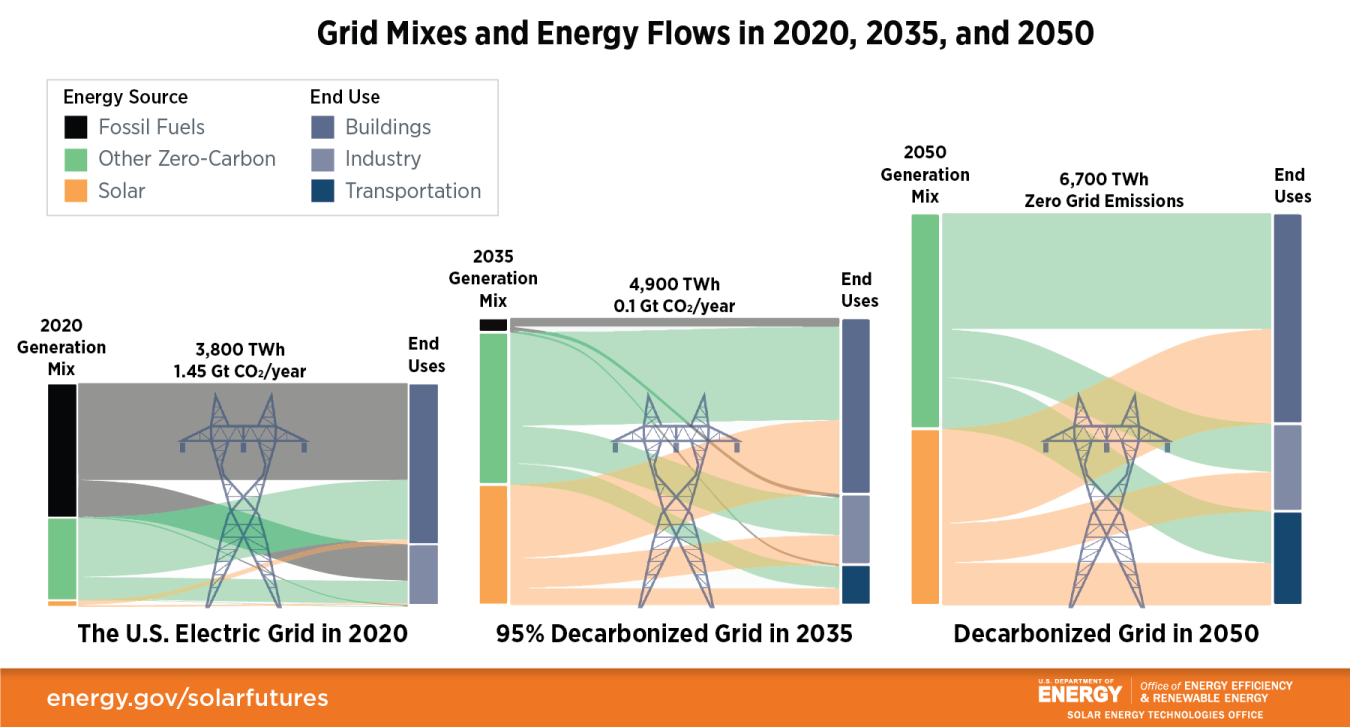
Grid mixes and energy flows in 2020 and 2050 as envisioned in the Solar Futures Study. Newly electrified loads from the buildings, transportation, and industrial sectors mean that the electric grid will deliver more energy in 2050. This energy will come almost entirely from solar and other zero-carbon sources.

The Decarbonization with Electrification scenario will reduce grid emissions (relative to 2005 levels) by 95% in 2035 and 100% in 2050 and replace some direct fossil fuel use in the buildings, transportation, and industrial sectors, allowing it to abate more than 100% of 2005 grid emissions.