

This is a guide to some of the more common terms you’ll come across in CMEI's Google Analytics 4 (GA4) reports, but is not exhaustive.
Terminology
Google Analytics sorts data into dimensions and metrics. You’ll see these terms repeated frequently below, so it’s important to define what the difference is between the two. According to Google’s own definitions:
- A metric is a quantitative measurement, such as an average, ratio, percentage, and so on. It's always a number as opposed to text. One way to think about metrics is that you can apply mathematical operations to them. An example of a metric is Event Count, which shows the total number of times an event is triggered.
- A dimension is an attribute of your data. It describes your data and it's usually text as opposed to numbers. An example of a dimension is Event Name, which shows the name of an event that someone triggers on your website or application (such as "click").
So, for example, on a webpage, a dimension would define a category for the data like Event Type or Page Title, while a metric would define the measurement of events on that webpage, like number of clicks, time on page, etc. Dimensions describe what kind of data it is, while metrics help define how many.
NOTE: Google Analytics 4 relies heavily on data sampling, which results in different numbers from one report to the next. The numbers may look exact, but they are estimates based on a subset of the data.
Metrics
Users
A user is defined by Google as "a person who interacts with an app or site whose activities you measure with Google Analytics." Think of it like a visitor to the site. This definition remains the same across both versions of Analytics, but the primary metric has changed.
Google's previous version of analytics, Universal Analytics (UA), highlighted Total Users (the raw number of users who have visited your webpage) in most reports, whereas GA4 focuses on Active Users in its reports. Total User counts are still available as a separate metric in GA4.
Active Users count the number of website visitors that have taken part in an engaged session.
Sessions
As defined by Google, a session is a group of user interactions with your website or app that take place within a given time frame. Think of it like a visit on the site. One user can log multiple visits, or sessions.
A session begins when a user views a page or screen and no other session is currently active. There is no time limit to how long a session can last as long as the user is active.
By default, a session ends (times out) after 30 minutes of user inactivity, but the session timeout period can be adjusted.
Additionally, GA4 makes some changes to how sessions are tracked. For example, if a user is on a page and the clock passes midnight, a new session is no longer created as it was in Universal Analytics.
An engaged session is defined by Google as "a session that lasted 10 seconds or longer, or had 1 or more key events or 2 or more page or screen views."
For example, a person who visits a web page for 15 seconds without clicking on any links before leaving, or who scrolls down and clicks on a link would be defined as an engaged session. A person who visits the same web page and leaves after 9 seconds without taking any actions would not be counted in this metric.
Views
Views (formerly called pageviews) count the number of total pages viewed by all users during all sessions.
One user can log several visits with multiple page views, so CMEI generally reports these three top-line metrics.
GA4 removed the Unique Pageviews metric that was present in UA. Also, GA4 counts a combination of screenviews from apps and pageviews from browsers, whereas UA tracked mobile screenviews separately.
Events
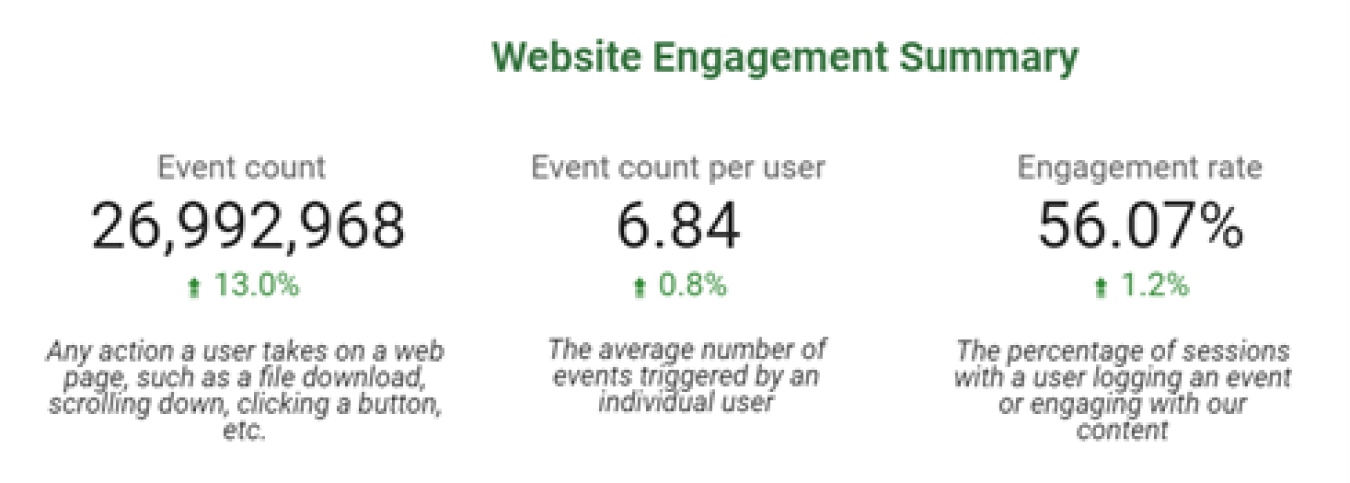
An event is any action that a user takes when interacting with a webpage. These include file downloads, scrolling down a page, or clicking a button; some events are automatically collected and defined by GA4, while others are set up by website administrators. The event is the basic unit underpinning GA4.
All actions on a website are events and counted. This overall number is captured in the Total Events metric in GA4 reports.
Event count rolls up the number of actions that users have take on a web page or group of pages, such as a file downloads, scrolling down, clicking a button, starting a video, etc.
CMEI reports also include event counts per user, which provides an easier way to understand how many actions the average user takes on a page or group of pages.
Engagement Rate
Engagement rate is the percentage of sessions that were engaged sessions with a user logging an event or engaging with our content.
For our GA4 reports, CMEI has moved to engagement rate as it shows a better percentage of our users that are actively engaging with the content we create. As Google notes, "Bounce rate, as it's calculated in Universal Analytics, is a reasonable measure of site engagement, but it has become less useful as websites and apps have changed." Engagement rate, as a metric, better captures the number of people actively viewing CMEI websites.
Average Engagement Time
This metric measures the average time a user is engaged on a page. It replaced Average Time on Page as a metric in Google Analytics 4; Average Time on Page metrics recorded only time that a user spent on a page during a session, regardless of if the user engaged in any events (link clicks, scrolling, etc.).
Dimensions
Google defines dimensions as non-numeric categories or attributes of your data set. Some of the more common dimensions are detailed below.
Session Source
This dimension tracks where a session originated. Generally, sources will include communications channels such as email or social media, as well as search engines and other websites.
Session Medium
This dimension tracks how the user starting the session arrived. Common examples of mediums include organic traffic, direct link clicks, paid traffic and referrals.
Browser
This dimension tracks the browser used to access the website, page, etc.
Device Category
This dimension tracks the type of device that accessed the website, page, etc. Generally, this is filtered by whether the user or session came from desktop, mobile, etc.
Region
This dimension tracks where a user/session originated from, via IP address. Region replaced Metro as a dimension in Google Analytics 4 and defaults to state-level reporting.