
Energy Department research is taming the duck curve by helping utilities better balance energy supply and demand on the grid.
Solar Energy Technologies Office
October 12, 2017Learn about the duck curve and how solar can help balance hourly energy loads.
In 2013, the California Independent System Operator published a chart that is now commonplace in conversations about large-scale deployment of solar photovoltaic (PV) power. The duck curve—named after its resemblance to a duck—shows the difference in electricity demand and the amount of available solar energy throughout the day. When the sun is shining, solar floods the market and then drops off as electricity demand peaks in the evening. The duck curve is a snapshot of a 24-hour period in California during springtime—when this effect is most extreme because it’s sunny but temperatures remain cool, so demand for electricity is low since people aren’t using electricity for air conditioning or heating.
The duck curve represents a transition point for solar energy. It was, perhaps, the first major acknowledgement by a system operator that solar energy is no longer a niche technology and that utilities need to plan for increasing amounts of solar energy. This is especially true for places that already have high solar adoption, such as California, where one day this past March, solar contributed nearly 40% of electricity generation in the state for the first time ever.
Utility Challenges
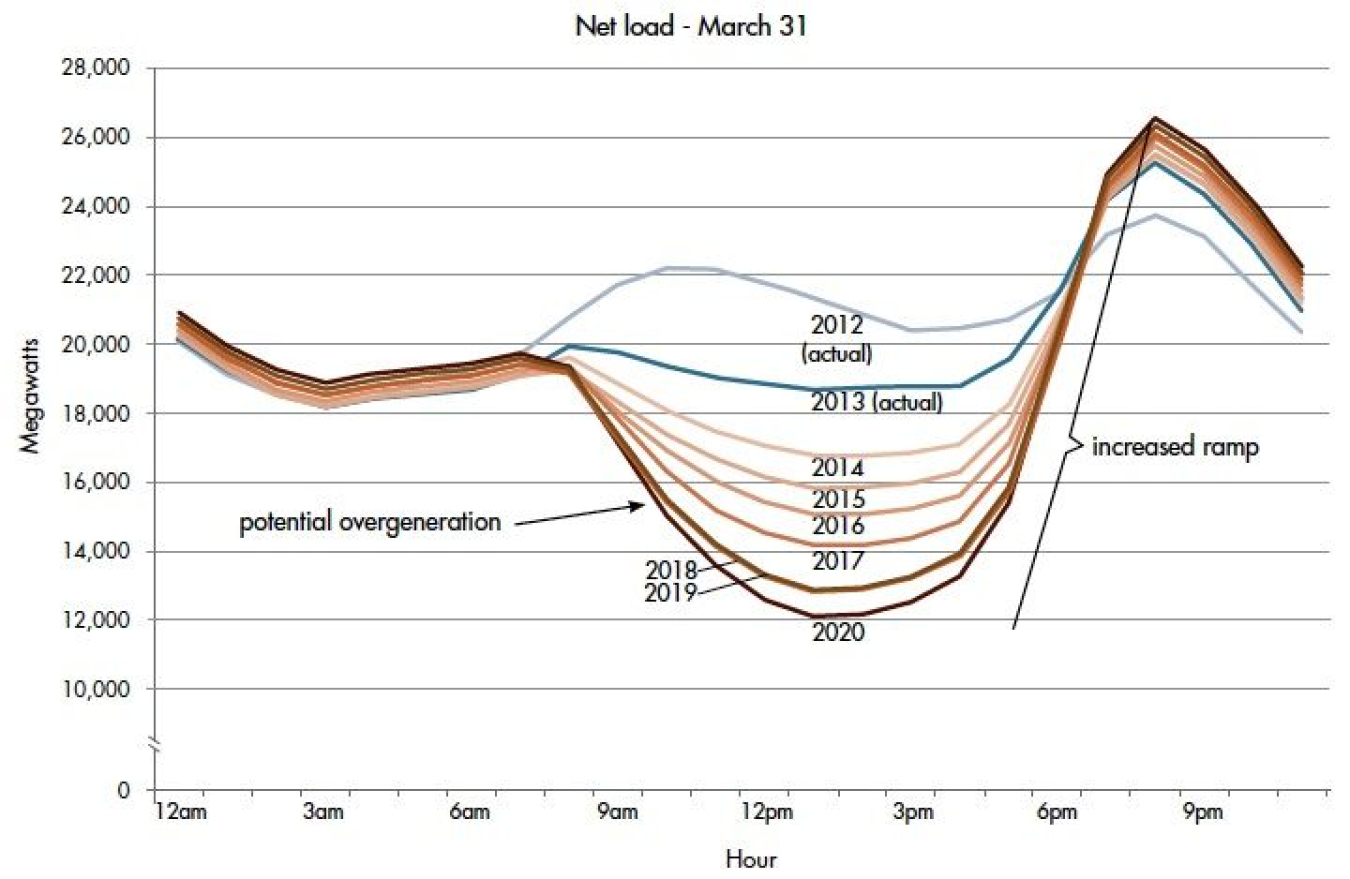
High solar adoption creates a challenge for utilities to balance supply and demand on the grid. This is due to the increased need for electricity generators to quickly ramp up energy production when the sun sets and the contribution from PV falls. Another challenge with high solar adoption is the potential for PV to produce more energy than can be used at one time, called over-generation. This leads system operators to curtail PV generation, reducing its economic and environmental benefits. While curtailment does not have a major impact on the benefits of PV when it occurs occasionally throughout the year, it could have a potentially significant impact at greater PV penetration levels.
While the mainstream awareness of these challenges is relatively recent, the U.S. Department of Energy’s Solar Energy Technologies Office (SETO) has been at the forefront of examining strategies for years. Most of the projects funded under SETO’s systems integration subprogram are performing work to help grid operators manage the challenges of the duck curve.
Duck Curve Solutions
Learn about SETO's project with Austin Energy.
Solar coupled with storage technologies could alleviate, and possibly eliminate, the risk of over-generation. Curtailment isn’t necessary when excess energy can be stored for use during peak electricity demand. SETO launched several projects in 2016 that pair researchers with utilities to examine how storage could make it easier for utilities to rely on solar energy to meet customer needs around the clock. This research will enable even more solar energy to be integrated into the grid, while tackling the obstacles utilities face when incorporating solar.
In 2012, SETO also launched a research program that helped utilities, grid operators, and solar power plant owners to better predict when, where, and how much solar power will be produced. More accurate solar power predictions, known as forecasts, allow utilities and electric system operators to better understand generation patterns and maximize solar resources. One key success came from IBM, whose machine-learning technology enabled prediction accuracy to be improved by 30%. However, as the amount of solar energy generation connected to our electric grid continues to grow at a rapid rate, further improvements in predictive accuracy will be needed.
Bringing it Back to the Duck Curve
There are many potential solutions to the duck curve. The lessons learned from SETO’s projects will be critical to improving the flexibility of the grid and addressing over-generation risks as solar grows throughout the country. According to the Energy Information Administration, the installed amount of PV is expected to triple by 2030—potentially migrating the duck curve outside of California. New and improved technologies will allow PV to provide on-demand capacity and fulfill a greater fraction of total electricity demand.
Learn more about our work to improve grid integration.
More by this author
-
 Deputy Assistant Secretary for Renewable Energy (Acting) and Solar Energy Technologies Office Director