
This article is a first in a series of communication pieces associated with the Manufacturing Energy and Carbon Footprints project from the U.S. Department of Energy Advanced Manufacturing Office.
Advanced Manufacturing & Industrial Decarbonization
May 20, 2022This article is a first in a series of communication pieces associated with the Manufacturing Energy and Carbon Footprints project from the U.S. Department of Energy Advanced Manufacturing Office.
The manufacturing sector, a subset of the industrial sector, consumed roughly 24 quads of total energy in 2018, accounting for approximately 74% of total industrial energy consumption, Figure 1 (DOE 2022; EIA 2021a, 2021b). The U.S. industrial sector is composed of four major types of industries: manufacturing, mining, construction, and agriculture. Improving efficiency, reducing energy use and greenhouse gas (GHG) emissions, and increasing competitiveness of the U.S. manufacturing sector is the core mission of the U.S. Department of Energy Advanced Manufacturing Office (AMO).
In order to increase energy and material efficiency in manufacturing, drive U.S. economic competitiveness, and enable an equitable transition to a decarbonized energy system by 2050, AMO partners with industry, academia, states, and National Laboratories to catalyze research, development, demonstration, and deployment (RDD&D) and the adoption of advanced manufacturing technologies and practices.
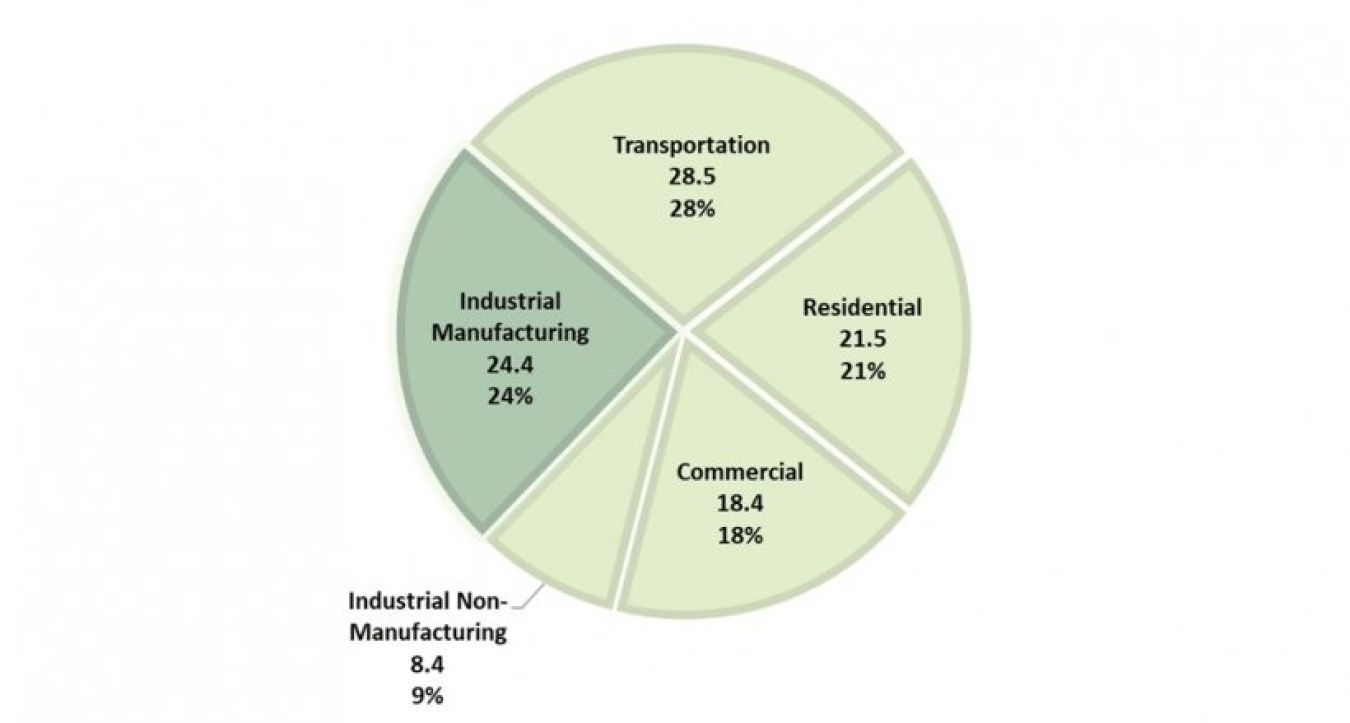
Figure 1: Breakdown of total energy consumption for the end use sectors of the U.S. economy in 2018. Total energy consumption was roughly 101 quads and industrial manufacturing accounted for roughly 25% of the total (DOE 2022; EIA 2021a, 2021b).
To better understand and visualize the flow, end uses of energy, and GHG emissions within the U.S. manufacturing sector, AMO publishes its Manufacturing Energy and Carbon Footprints analysis every four years. The footprints map manufacturing energy use and GHG emissions from energy supply to major end uses, including process heaters, machine-driven equipment, boilers, and power generators. The footprints are based on the U.S. Energy Information Administration’s (EIA) Manufacturing Energy Consumption Survey (MECS), along with referenced energy loss and emissions factors, and input from industry and subject matter experts.
MECS provides survey results of actual plant data, so the AMO footprints represent a genuine distribution of energy consumption and GHG emissions across the manufacturing sector. They provide a benchmark to assess energy consumption and GHG emission patterns since the prior MECS data were released, helping to illuminate opportunities for technologies and practices to drive further improvements.
Energy consumption in the manufacturing sector
In addition to the footprints, which presents a holistic picture of manufacturing energy consumption, loss, and GHG emissions, meaningful insights can also be gleaned by examining certain segments of MECS data. For example, Figure 2 shows the following trends from the past five MECS iterations (data for years 2002, 2006, 2010, 2014, and 2018).
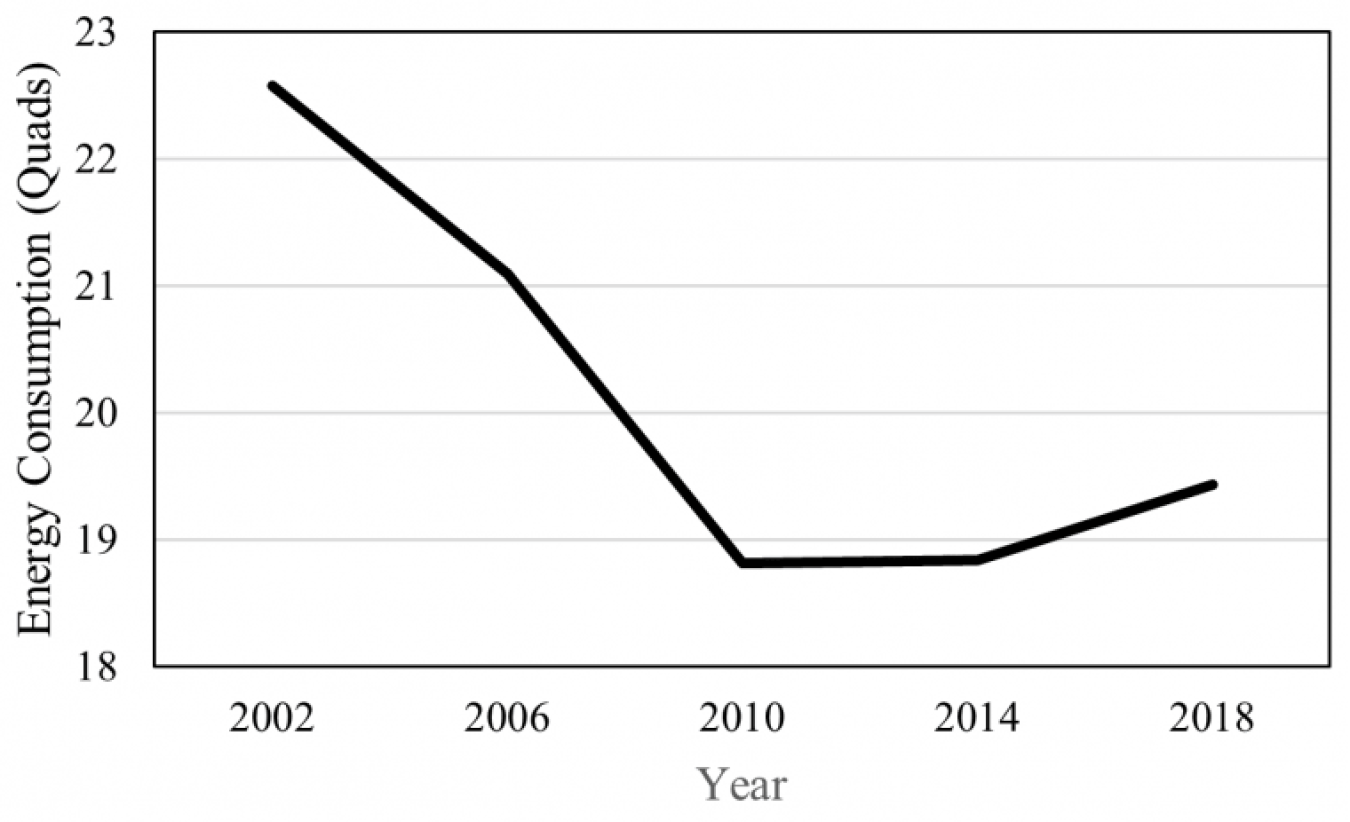
Figure 2: Total energy used for all purposes (first use) in the U.S. manufacturing sector from 2002 to 2018 (EIA 2021c)
Figure 2 depicts the total energy used for all purposes (first use) for the manufacturing sector. First use of energy is defined as the energy consumed, whether generated onsite or offsite, for all end uses, excluding electricity produced from onsite fuel consumption.
A 16% decrease in first use of energy was observed between 2002 and 2010, and there was a 3% increase between 2010 and 2018. The largest iteration to iteration change was a 11% decrease between 2006 and 2010.
Table 1 provides a more granular view of energy consumption for specific sectors within U.S. manufacturing. The 15 sectors included in the table account for roughly 90% of first use of energy consumed in the manufacturing sector. For the Manufacturing Energy and Carbon Footprints, individual footprint visualizations are generated for each sector. Any sector outside of these 15 is captured in the “All Manufacturing” footprint. The top five largest energy consuming sectors, which have not changed since 2002, account for roughly 80% of first use of energy and represent the primary drivers of energy consumption within the manufacturing sector.
Table 1: Breakdown of first use of energy and iteration rankings (from largest energy consumption to smallest energy consumption) for the 15 distinct footprint sectors and all manufacturing (EIA 2021c).
|
Manufacturing Sector |
First Use of Energy (TBtu) |
Rank |
First Use of Energy (TBtu) |
Rank |
First Use of Energy (TBtu) |
Rank |
First Use of Energy (TBtu) |
Rank |
First Use of Energy (TBtu) |
Rank |
| 2018 | 2014 | 2010 | 2006 | 2002 | ||||||
| Chemicals | 7,141 | 1 | 6,297 | 1 | 4,995 | 2 | 5,149 | 2 | 6,465 | 1 |
| Petroleum Refining | 3,375^ | 2 | 3,372^ | 2 | 5,922^ | 1 | 6,629^ | 1 | 6,391^ | 2 |
| Forest Products | 2,429 | 3 | 2,473 | 3 | 2,582 | 3 | 2,805 | 3 | 2,740 | 3 |
| Food and Beverage | 1,279 | 4 | 1,208 | 4 | 1,247 | 4 | 1,293 | 4 | 1,228 | 5 |
| Iron and Steel | 1,100 | 5 | 1,159 | 5 | 1,134 | 5 | 1,118 | 5 | 1,380* | 4 |
| Glass and Glass Products | 483 | 6 | 508 | 6 | 449 | 6 | 725 | 6 | 662 | 6 |
| Transportation Equipment | 348 | 7 | 323 | 8 | 279 | 8 | 477 | 7 | 429 | 7 |
| Cement | 296 | 8 | 300 | 9 | 246 | 10 | 382 | 9 | 409 | 8 |
| Plastics and Rubber Products | 257 | 9 | 295 | 10 | 275 | 9 | 337 | 10 | 351 | 12 |
| Fabricated Metals | 257 | 10 | 349 | 7 | 302 | 7 | 396 | 8 | 388 | 9 |
| Alumina and Aluminum | 217 | 11 | 254 | 11 | 237 | 12 | 307 | 11 | 383 | 10 |
| Computers, Electronics, and Electrical Equipment | 195 | 12 | 236 | 12 | 239 | 11 | 245 | 13 | 373 | 11 |
| Machinery | 148 | 13 | 165 | 13 | 149 | 13 | 204 | 14 | 177 | 14 |
| Foundries | 93 | 14 | 119 | 15 | 100 | 15 | 164 | 15 | 165 | 15 |
| Textiles | 92 | 15 | 133 | 14 | 123 | 14 | 267 | 12 | 304 | 13 |
| All Manufacturing | 19,436 | N/A | 18,835 | N/A | 18,817 | N/A | 21,098 | N/A | 22,576 | N/A |
^Starting with the 2014 MECS iteration, EIA chose to allocate nonfuel energy consumption of the petroleum refining sector to downstream sectors to avoid double-counting. This is why MECS iterations in 2002, 2006, and 2010 see significantly larger petroleum refining energy consumption values compared with more recent iterations (2014 and 2018) and petroleum refining is ranked ahead of the chemicals sector for these years. This is simply the result of a change in how EIA accounts for nonfuel energy consumption and does not reflect an actual decrease in energy consumption for the petroleum refining sector.
*First use of energy for the iron and steel sector for MECS 2002 was not adjusted for blast furnace/coke oven gas double-counting. This value is estimated to be around 140-180 TBtu and it may push the iron and steel sector into 5th for 2002, which is in line with the other MECS iterations.
References
DOE (Department of Energy). 2022. Manufacturing Energy and Carbon Footprints. https://www.energy.gov/eere/amo/manufacturing-energy-and-carbon-footprints-2018-mecs
EIA (Energy Information Administration). 2021a. “Monthly Energy Review. Table 2.1 Energy Consumption By Sector.” https://www.eia.gov/totalenergy/data/monthly/
———. 2021b. Use of energy explained: Energy Use in Industry. https://www.eia.gov/energyexplained/use-of-energy/industry.php
———. 2021c. Manufacturing Energy Consumption Survey (MECS). “Table 1.2 Consumption of Energy for All Purposes (First Use) By Manufacturing Industry and Region (trillion Btu).” https://www.eia.gov/consumption/manufacturing/data/2018/