U.S. Energy and Employment Reports
The U.S. Energy and Employment Report (USEER) began in 2016 at the recommendation of the first Department of Energy Quadrennial Energy Review to better track and understand employment within key energy sectors that have been difficult to impossible to follow using other publicly available data sources. This study combines surveys of businesses with public labor data to produce estimates of employment and workforce characteristics. Since 2016, when DOE first began tracking energy employment in the United States, the sector grew more than six percent by the end of 2019, responsible for 8.4 million jobs.
Prior to the COVID-19 pandemic, the energy sector had been one of the country’s fastest growing job markets. From 2015 to 2019, the annual growth rate for energy employment in the United States was 3%—double compared to 1.5% in the general economy.
In 2020, the COVID-19 pandemic led to an unprecedented global shutdown and economic impacts—something even the traditionally strong energy sector wasn’t immune to. The USEER found that energy job totals reached 7.5 million by the end of 2020, a decrease of 840,000 jobs or 10% decline year-over-year.
While there was a clear decline, there were also positive signs that the sector was on the rebound—at the pandemic’s peak in mid-2020 energy jobs had decreased by 1.4 million. By the end of 2020, 520,000 energy jobs had already returned. Additionally, employers that responded to the survey also signaled confidence in the upward employment trend continuing through 2021.
The report found that continued energy investments throughout the year actually prevented declines in some key areas, including:
- Wind generation increased by 2,000 jobs (2%)
- Battery storage increased by 800 jobs (1%)
- Hybrid electric vehicles increased by 6,000 jobs (6%)
- Electric vehicles also increased by 6,000 jobs (8%)
The DOE will resume its role as the trusted source to collect, analyze and share the USEER annually.
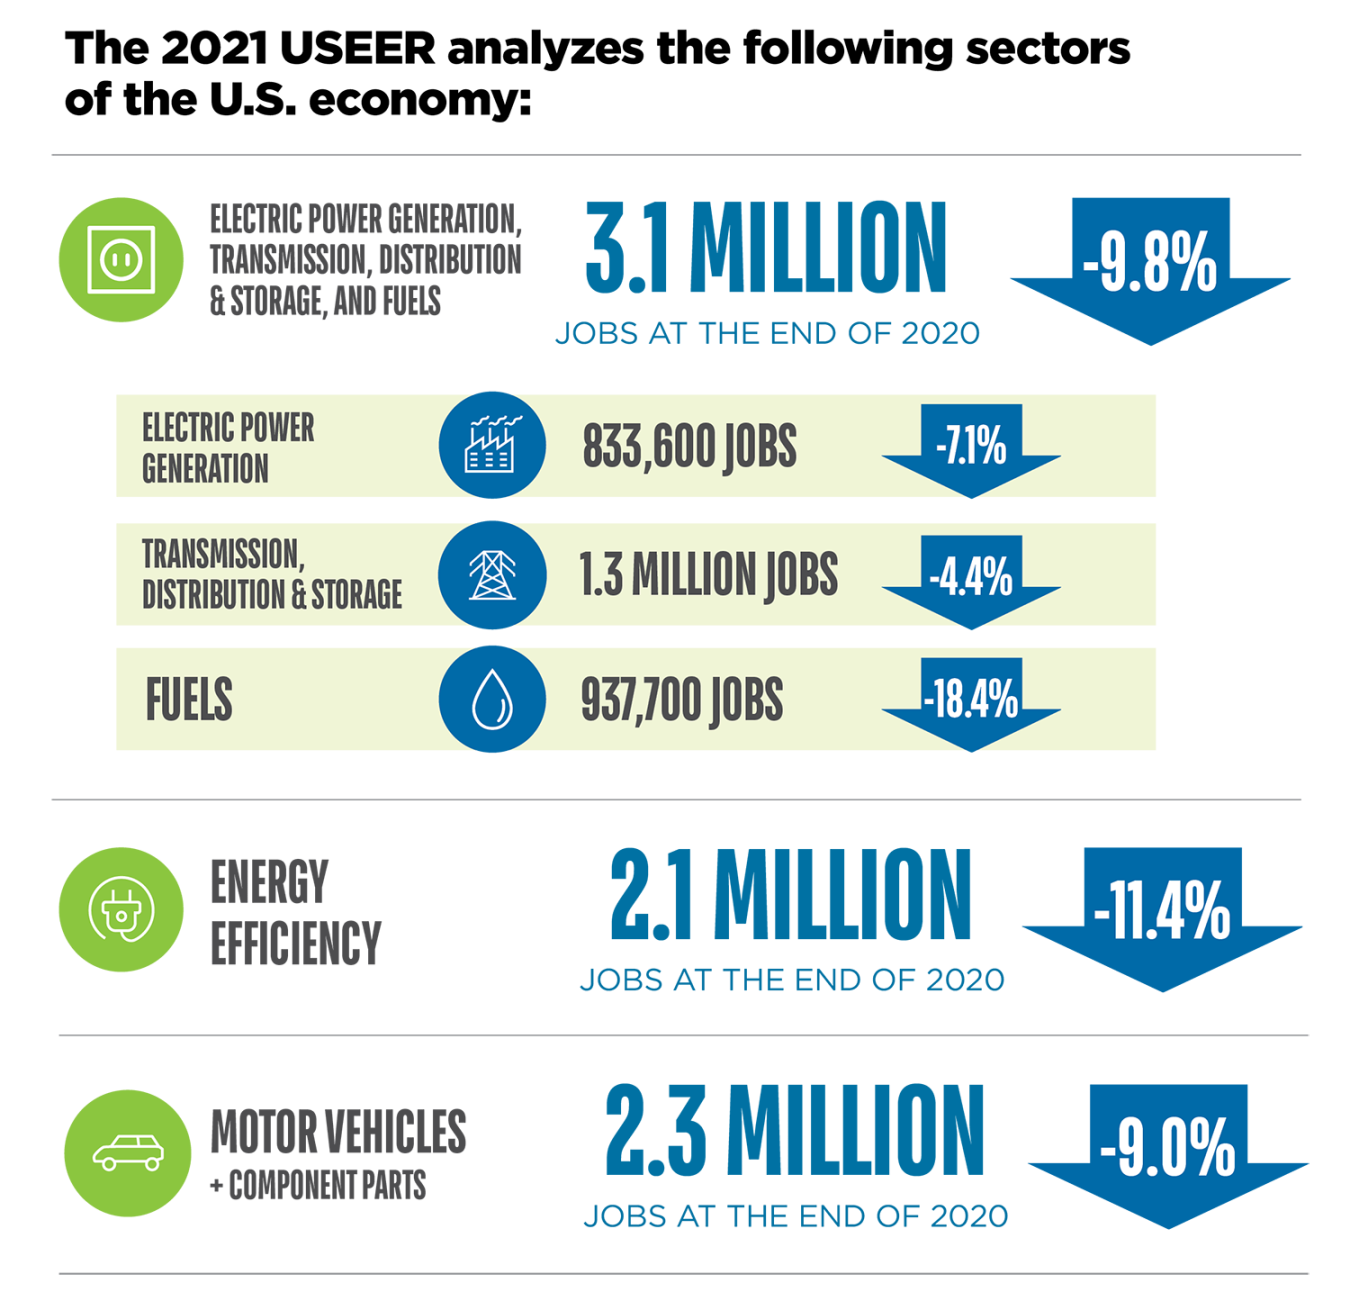
The USEER covers five major energy sectors: Electric Power Generation, Transmission, Distribution, and Storage, Fuels, Energy Efficiency, and Motor Vehicles. The combination of Electric Power Generation, Transmission, Distribution, and Storage, and Fuels, is the largest with 3.1 million workers – a decline of 9.8% from 2019. This is followed by Motor Vehicles with 2.3 million, a 9.0% decline, and Energy Efficiency with 2.1 million, an 11.4% decline.
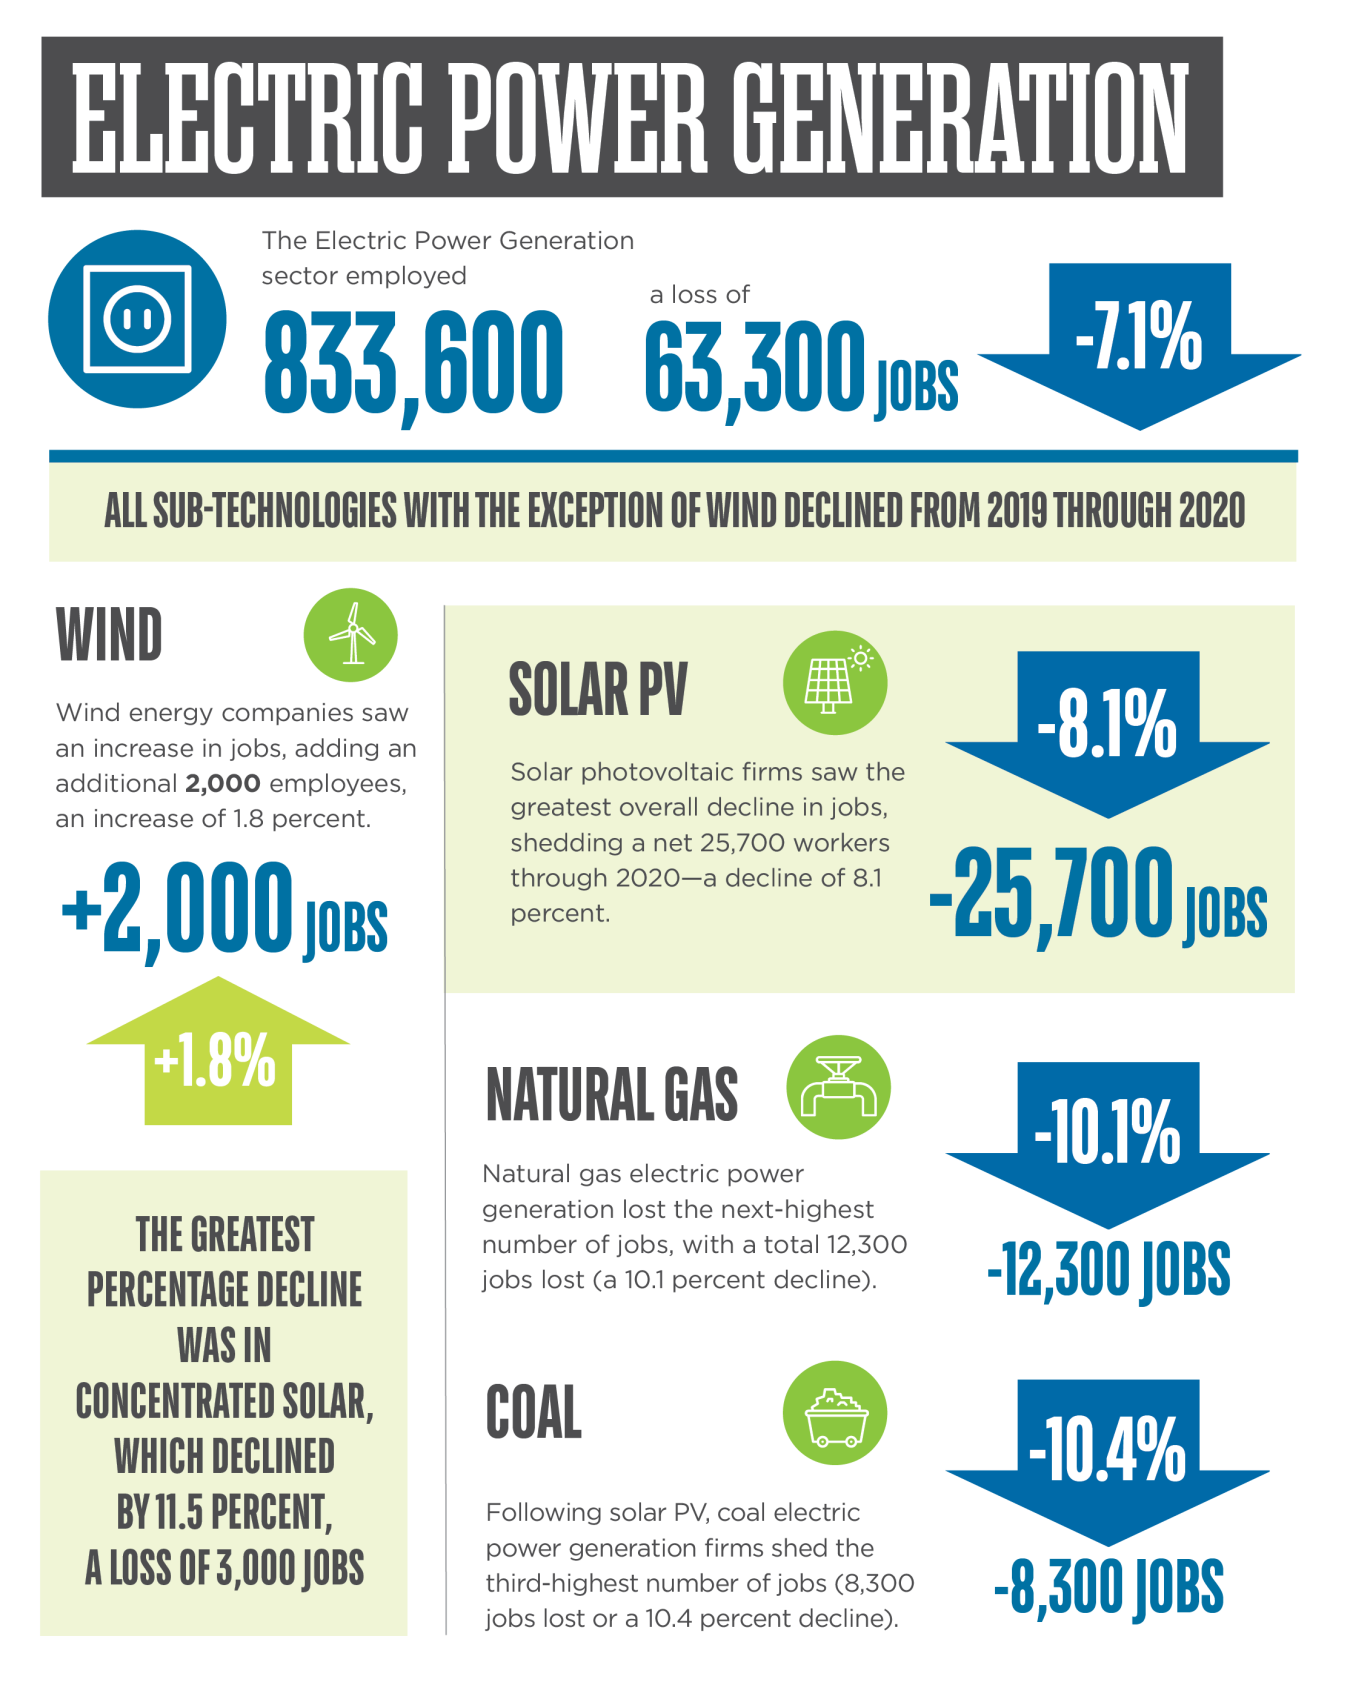
Electricity Power Generation
While Electric Power Generation declined by 63,300 jobs from 2019 to 2020 for a total of 833,600 jobs, not all types of generation declined. Wind added 2,000 jobs, an increase of 1.8%. Solar, which includes both Concentrating Solar Power and Photovoltaics, shed the most jobs, declining by 28,700. The largest year over year percent decline was in coal, which decreased 10%, or 8,300 jobs.
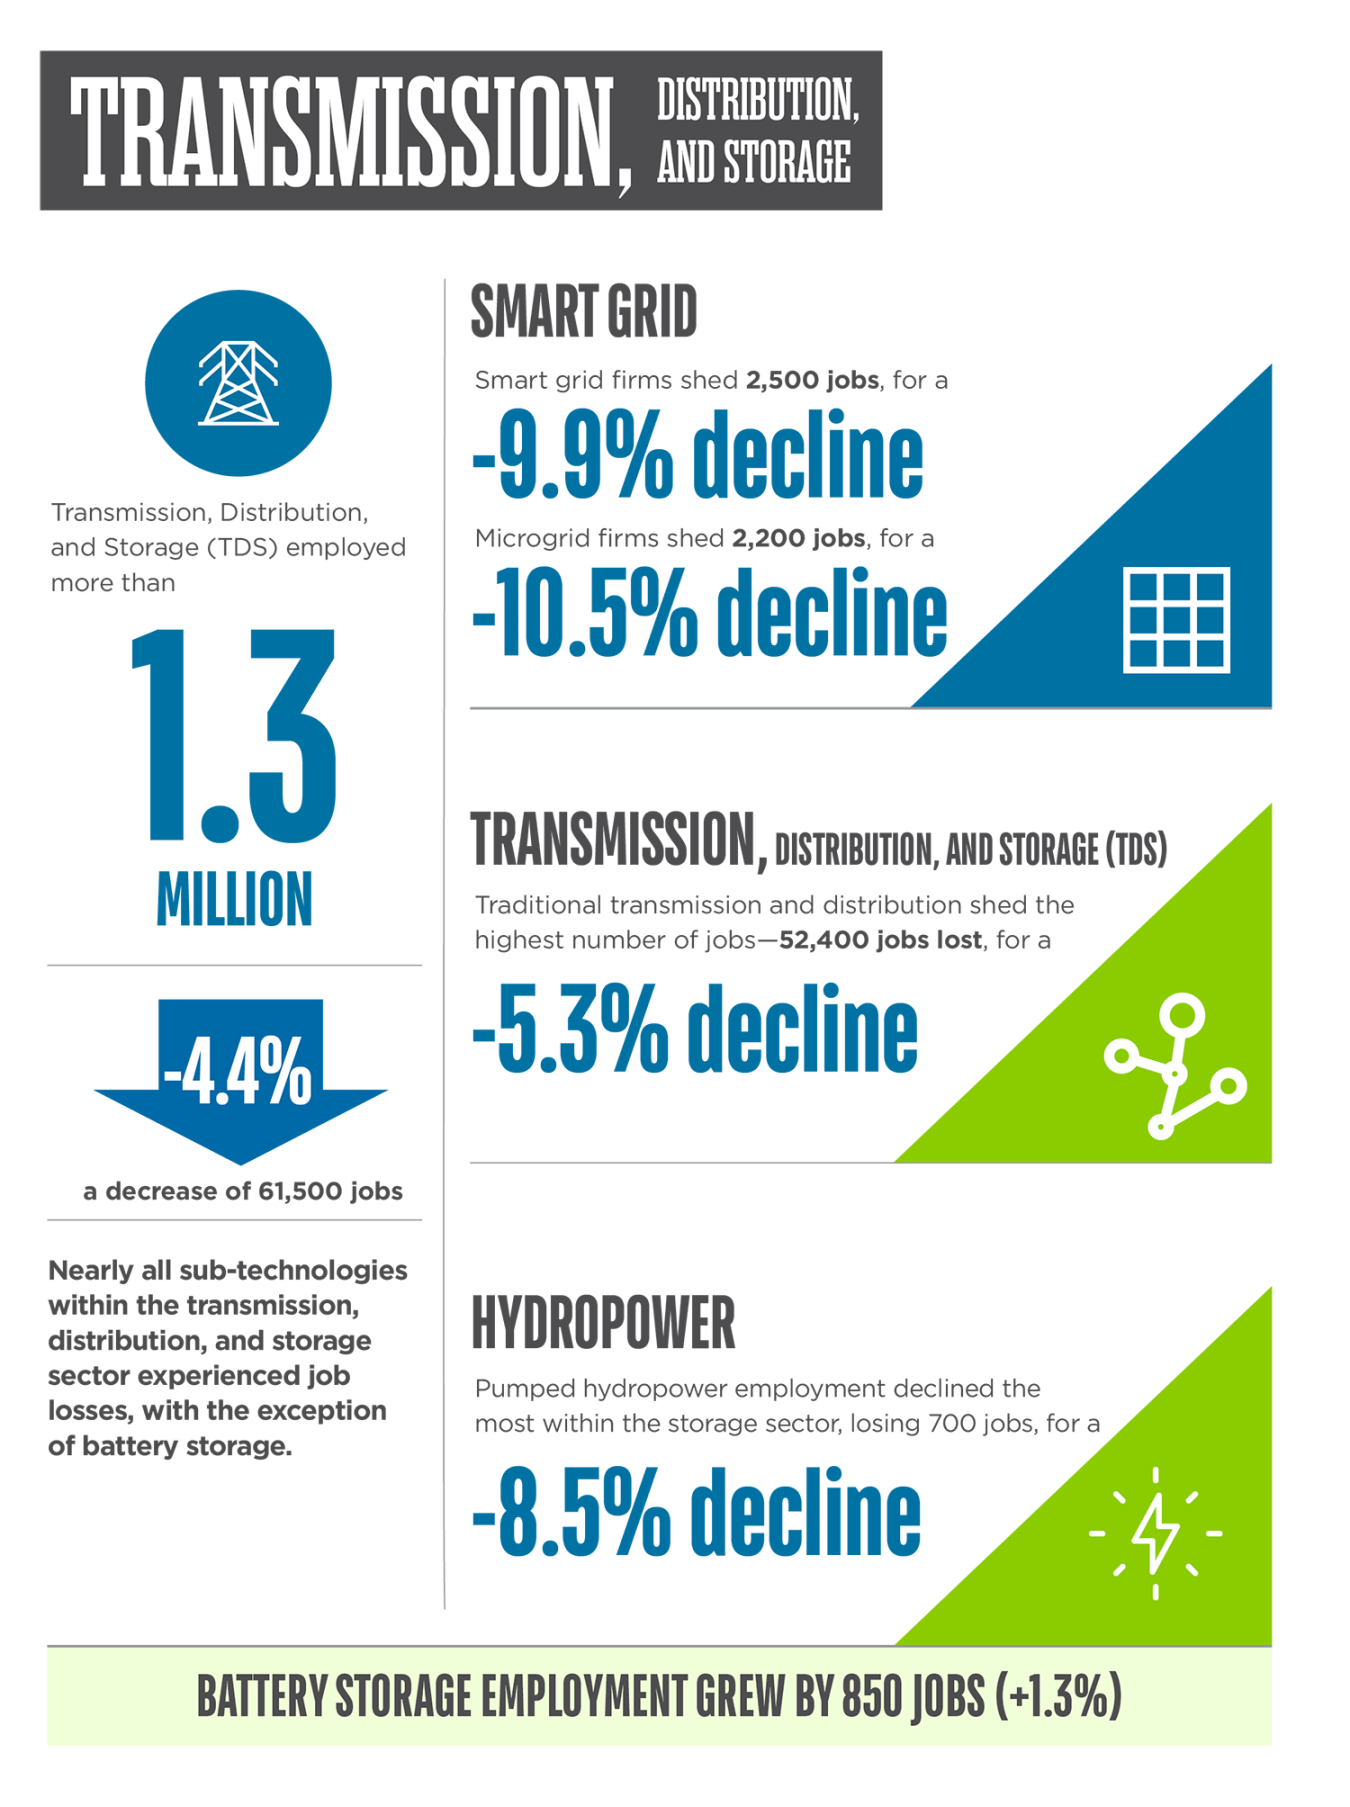
Transmission, Distribution, and Storage
Transmission, Distribution, and Storage experienced a decline of 61,500 jobs in 2020 from 2019 with a total of 1.32 million workers. This 4.4% decrease was the lowest among all five major energy job categories. No category of jobs within Transmission, Distribution, and Storage experienced losses, although nearly all declines, 52,400, were from the largest sector: Traditional Transmission and Distribution. Job losses in the remaining three categories ranged from 1,000 to 6,500.
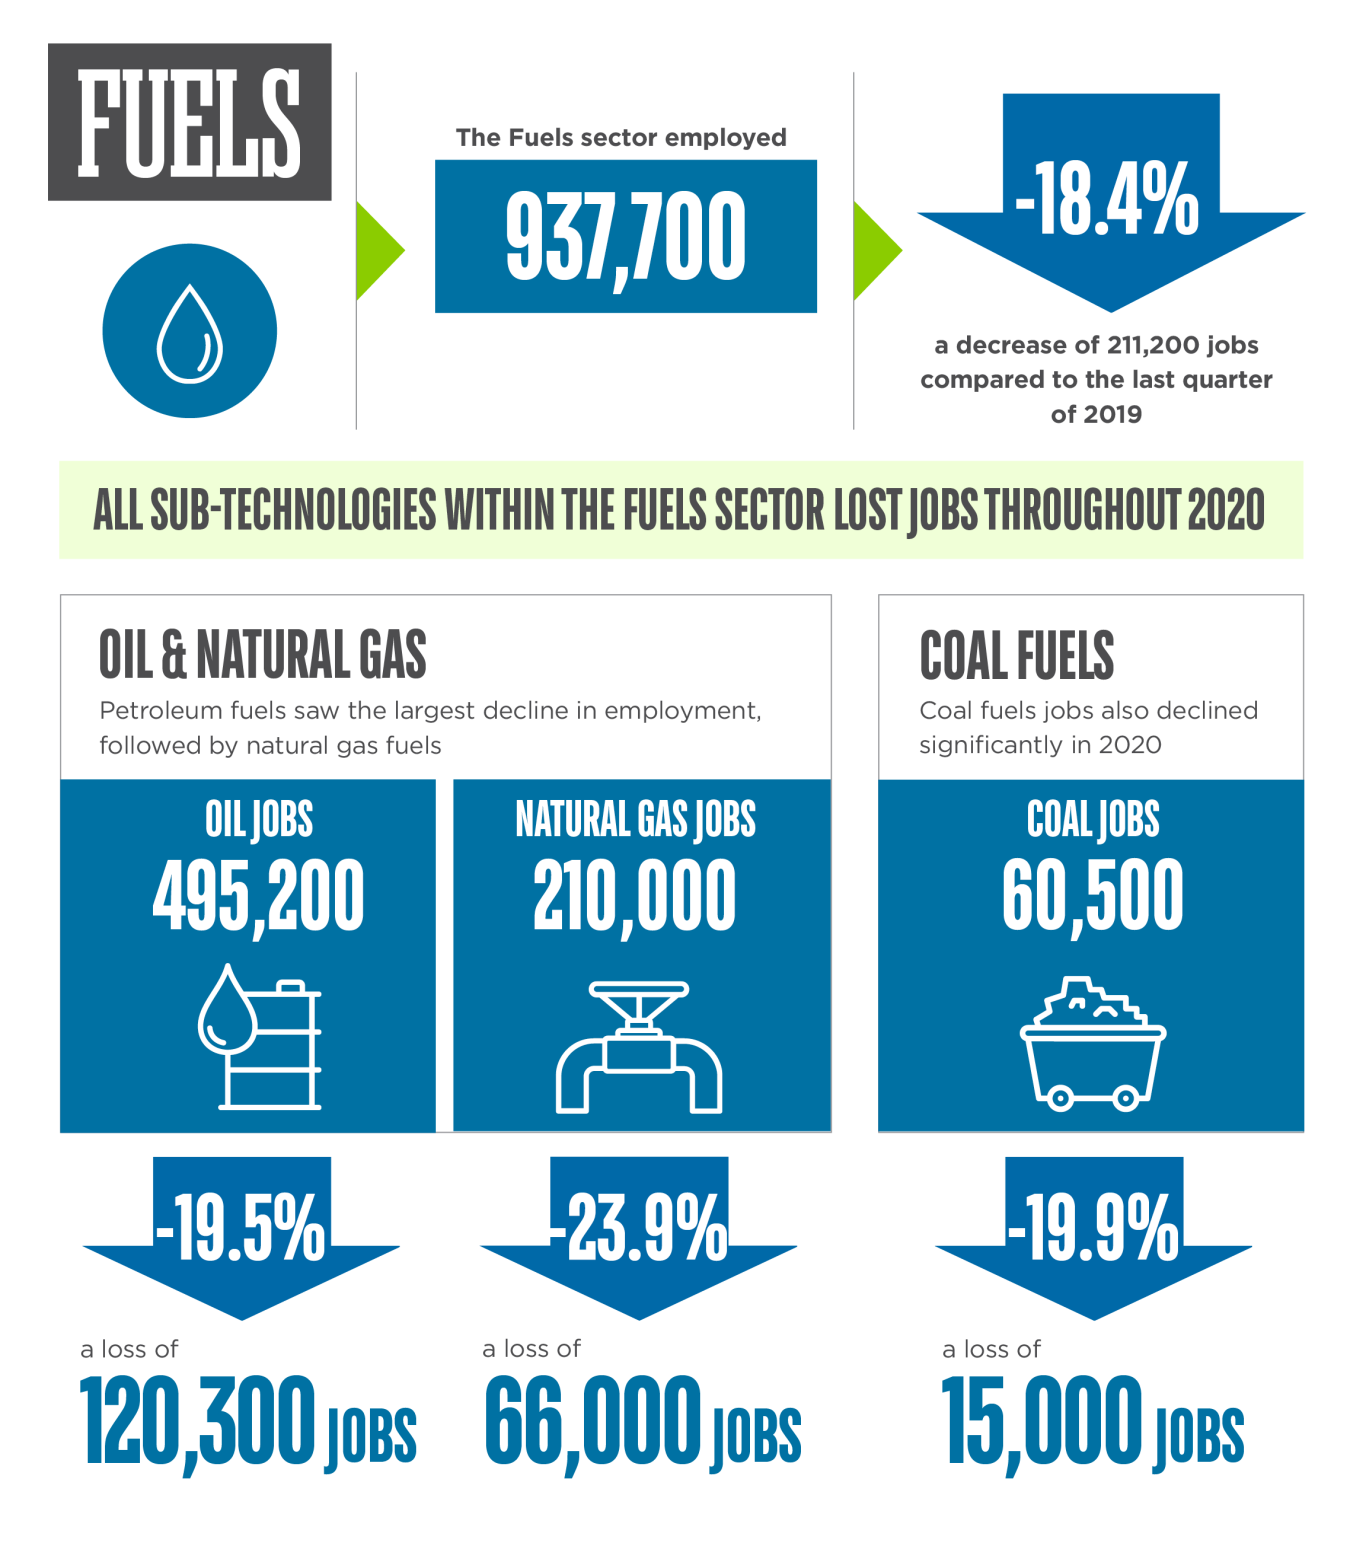
Fuels
Employing 937,700 workers in 2020, the Fuels sector declined 211,200 jobs from 2019. This 18% loss was the highest out of any of the five categories. Job losses were concentrated in oil and gas, with oil declining by 121,300 and gas decreasing 66,000. Job losses in biofuels were the lowest, ranging from 1,000 for Woody Biomass to 1,400 for Corn Ethanol.
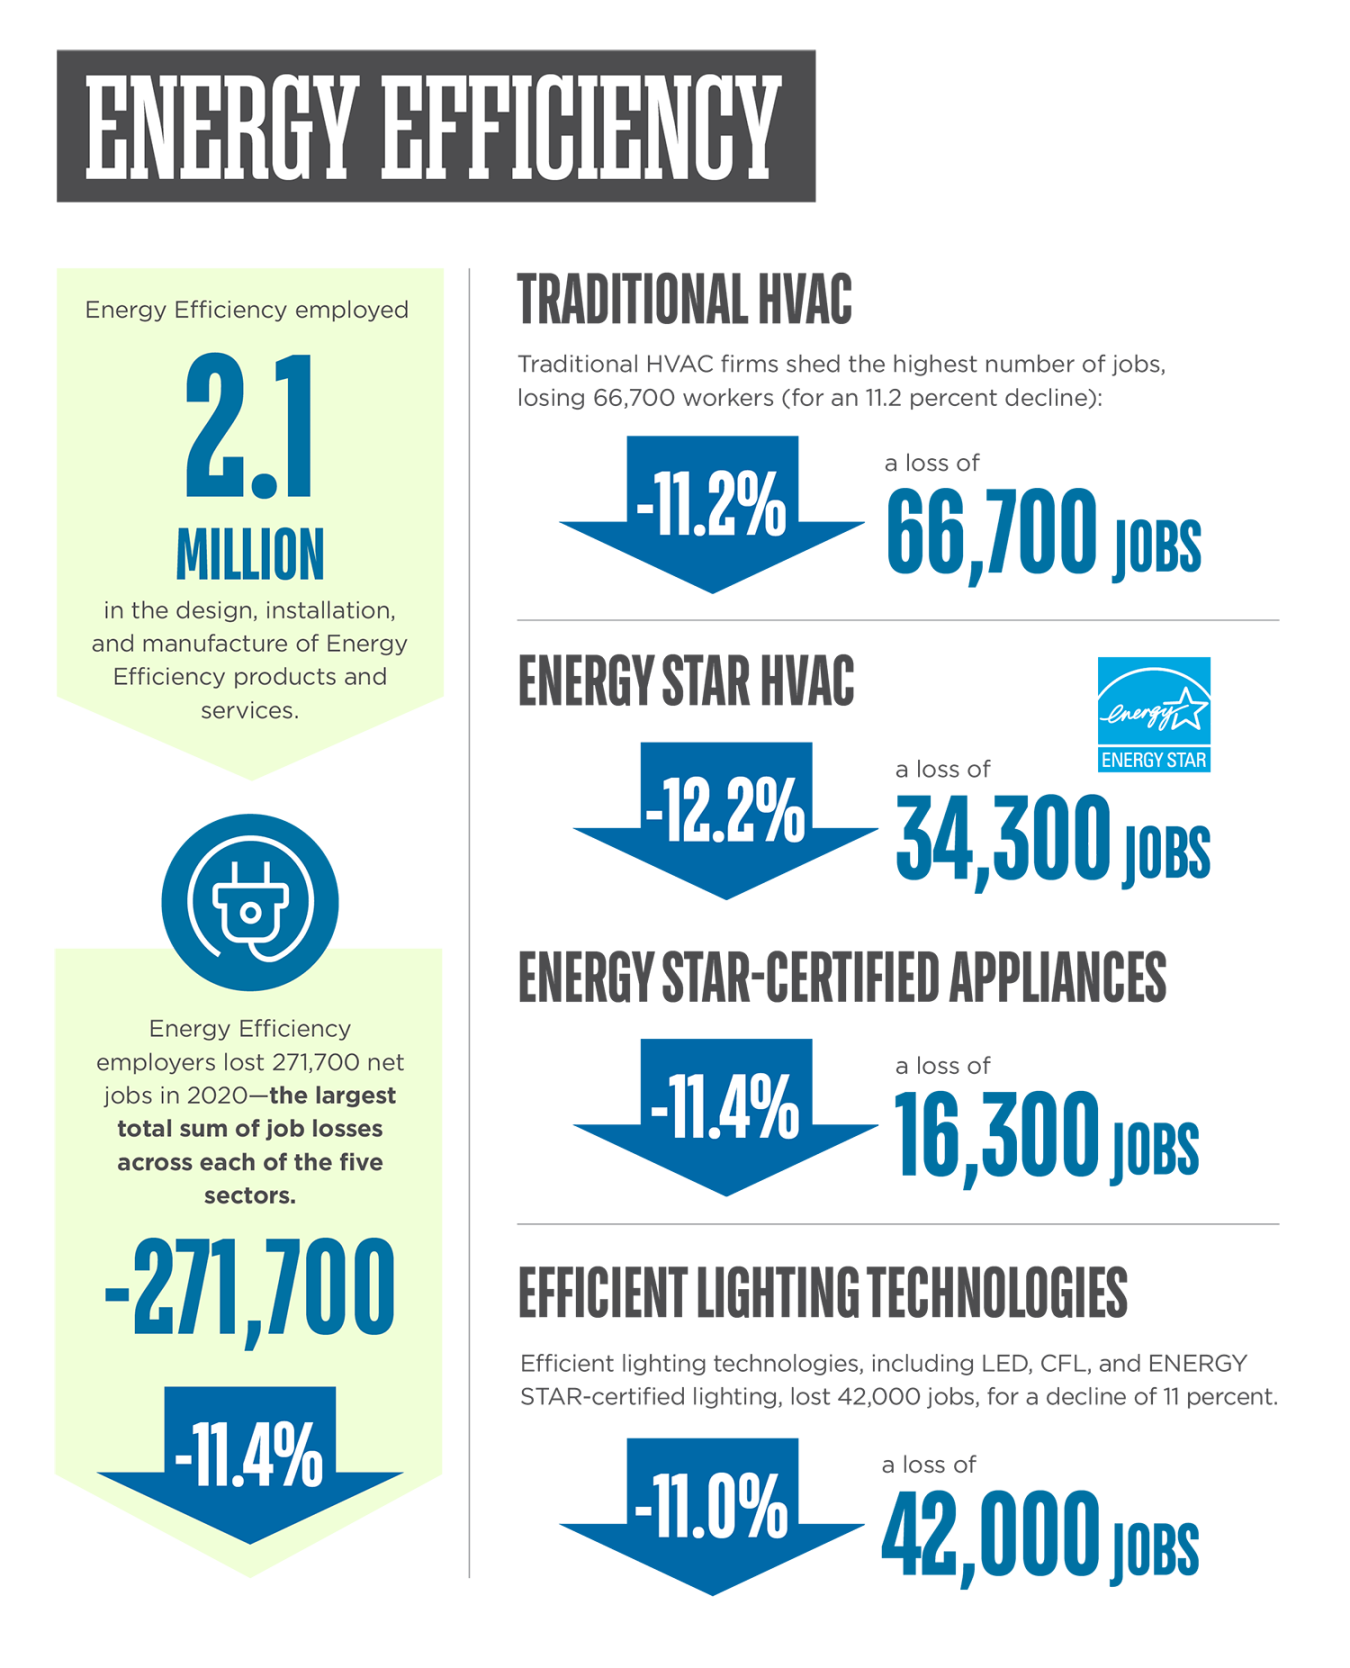
Energy Efficiency
Energy Efficiency employed 2.1 million workers in 2020, down 271,700 from 2019, a decline of over 11%. Traditional HVAC, High Efficiency HVAC and Renewable Heating and Cooling, and Energy STAR and Efficient Lighting each make up close to a quarter of these losses, with a total of 196,000 jobs. No sector within Energy Efficiency gained jobs.
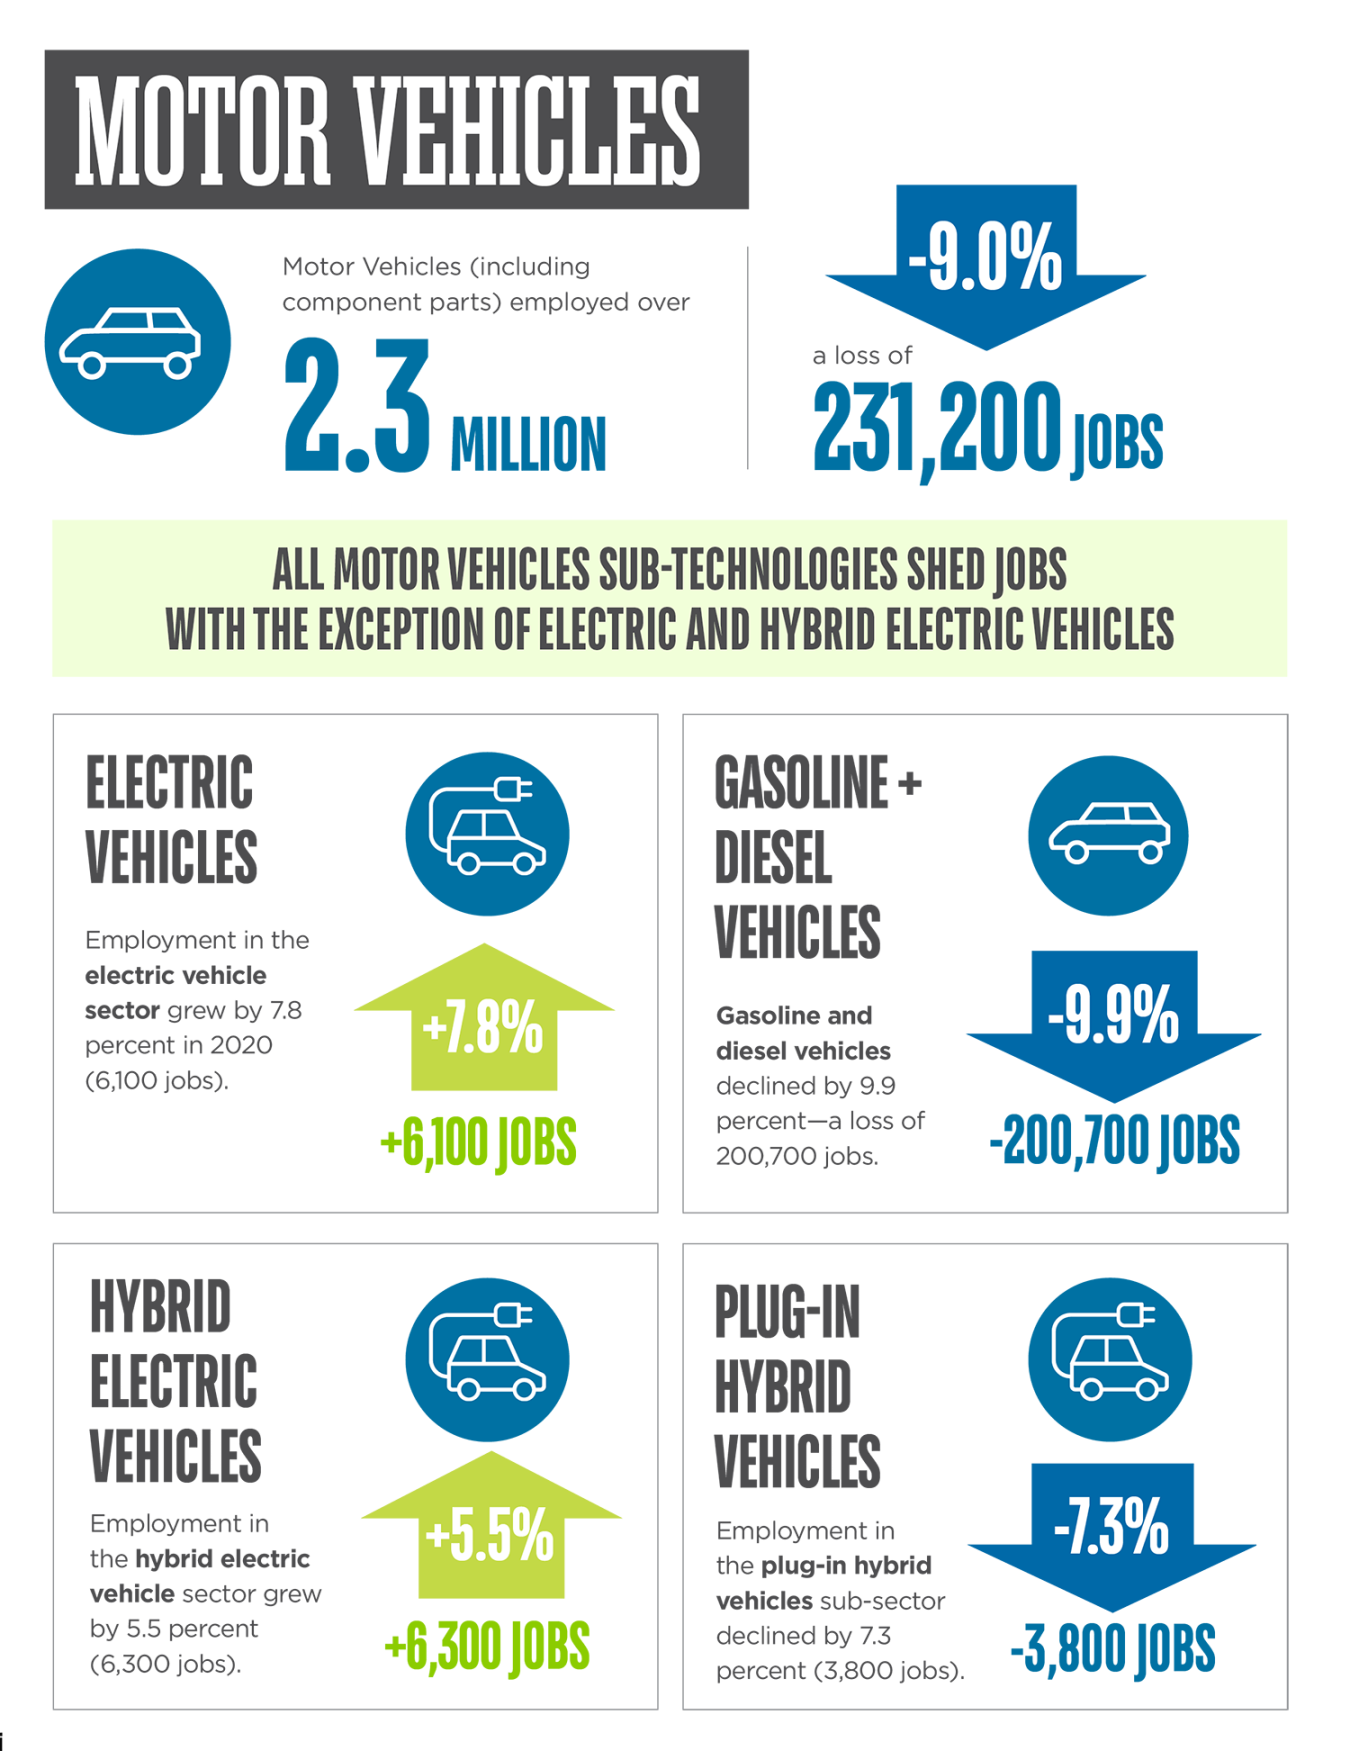
Motor Vehicles
While employment in Motor Vehicles declined by 231,000, there were job increases in Electric Vehicles and Hybrid Electric Vehicles. Those two sectors picked up 12,400 jobs. The largest job losses were in Gasoline and Diesel Vehicles which declined by 288,000, or a decrease of 14%. This was followed by 62,300 jobs within categories outside of those specified in the USEER.