
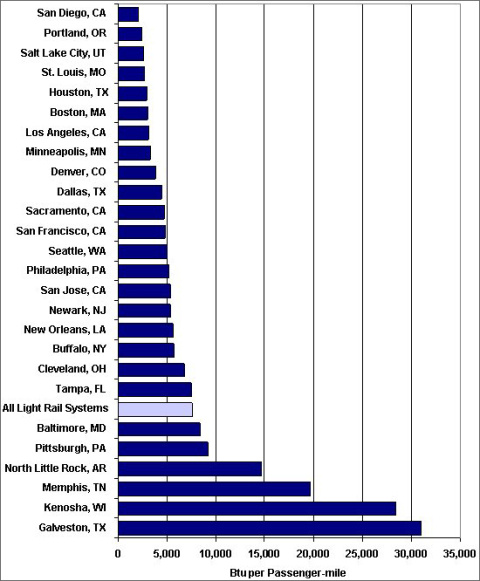
According to the 2007 National Transit Databases, the energy intensity of light transit rail systems in the U.S. ranges from about 2,000 Btu per passenger-mile to about 31,000 Btu per passenger-mile. There are only four light rail systems with energy intensity over 10,000 Btu per passenger-mile. These systems may have improved energy intensity in 2008 due to an increase in ridership (opens a window to American Public Transportation Association).
Energy Intensity of Light Rail Transit Systems, 2007
Image
Image

Supporting Information
| Place | Btu per Passenger Mile |
|---|---|
| San Diego, CA | 2,065 |
| Portland, OR | 2,387 |
| Salt Lake City, UT | 2,614 |
| St. Louis, MO | 2,684 |
| Houston, TX | 2,896 |
| Boston, MA | 3,023 |
| Los Angeles, CA | 3,158 |
| Minneapolis, MN | 3,258 |
| Denver, CO | 3,829 |
| Dallas, TX | 4,433 |
| Sacramento, CA | 4,677 |
| San Francisco, CA | 4,843 |
| Seattle, WA | 4,981 |
| Philadelphia, PA | 5,193 |
| San Jose, CA | 5,316 |
| Newark, NJ | 5,378 |
| New Orleans, LA | 5,612 |
| Buffalo, NY | 5,733 |
| Cleveland, OH | 6,753 |
| Tampa, FL | 7,470 |
| Average of All Light Rail Systems | 7,605 |
| Baltimore, MD | 8,379 |
| Pittsburgh, PA | 9,163 |
| North Little Rock, AR | 14,734 |
| Memphis, TN | 19,726 |
| Kenosha, WI | 28,422 |
| Galveston, TX | 31,013 |
Source: Calculated by Oak Ridge National Laboratory from the U.S. Department of Transportation, Federal Transit Administration, Annual 2007 National Transit Databases. | |