
Historically, solar photovoltaic PV modules have survived the majority of hail events they have experienced. In areas that have experienced very large hail (greater than 1 ¾" or 44 mm diameter), however, hail has caused significant damage to PV modules.
Some measures can be taken to limit damage to PV modules. This resource outlines these measures and best practices in the design phase and operations and maintenance phase and provides resources for evaluating hail risk.
Mitigating against hail damage may come with an additional upfront cost, which needs to be weighed against the risk of damage and expected loss for a particular site. The greatest contributor to insured losses on solar PV systems worldwide is severe hail. Severe hail events are forecasted to increase in frequency over time, emphasizing the increasing importance of designing and preparing for solar PV resilience to hail.
How to Determine Hail Risk
Many areas are prone to hail events, and the level of risk a site faces may not be intuitive. To determine hail risk, use a resource such as those listed below.
Hail Risk Resources
- The National Oceanic and Atmospheric Administration and National Weather Service's (NOAA) Storm Prediction Center provides severe weather reports per year.
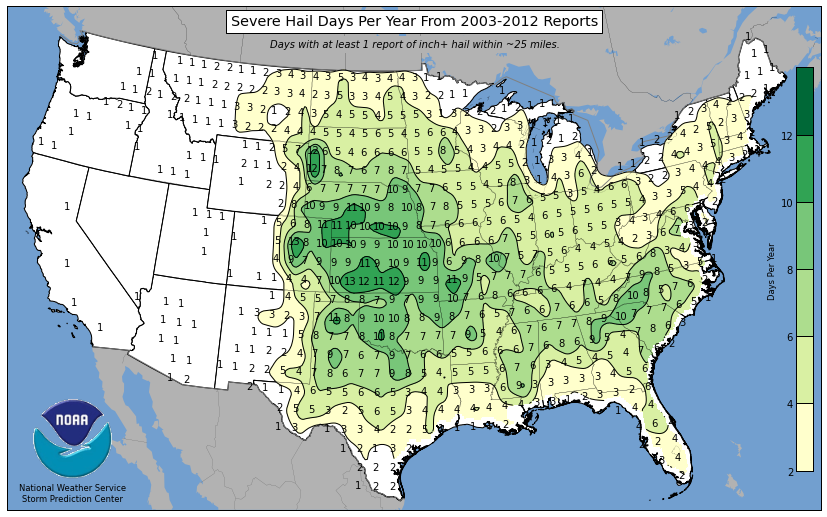
An example of a hail risk map of the contiguous Unites States that can be used to determine the level of hail risk.
- The Federal Emergency Management Agency's (FEMA) National Risk Index offers a county-level map interface with hazard risk ratings for hail, rated on a scale of "very low," "relatively low," "relatively high," and "very high." Use caution with this resource as it is solely based on historical events. There are many instances of a county with a "very high" hail risk adjacent to a county with a "low" hail risk simply because of the circumstances of past hailstorms, not because one is more likely than the other to be hit by a hailstorm in the future. Check nearby counties in addition to the county in which PV is sited for a better understanding of hail risk.
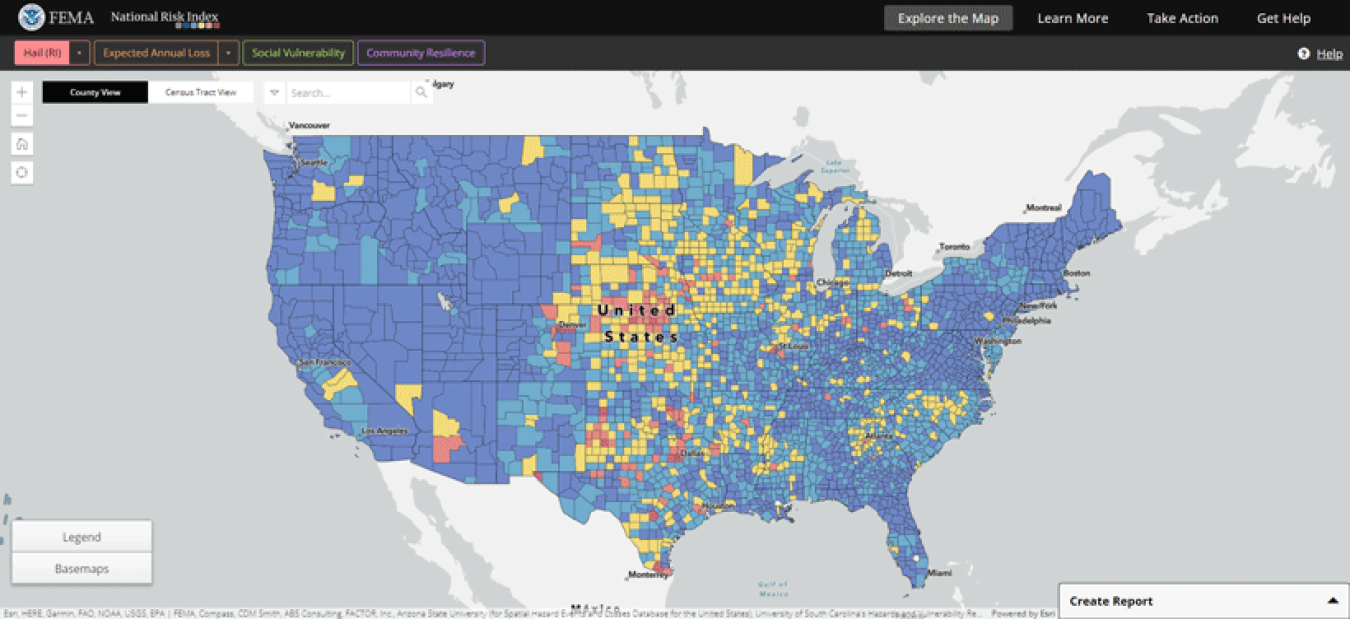
FEMA's National Risk Index map showing the risk index for hail in the contiguous United States
- NOAA Spotter (1955–1999) and NOAA Severe Weather Data Inventory Doppler Radar (2000–present) are historical severe hail databases.
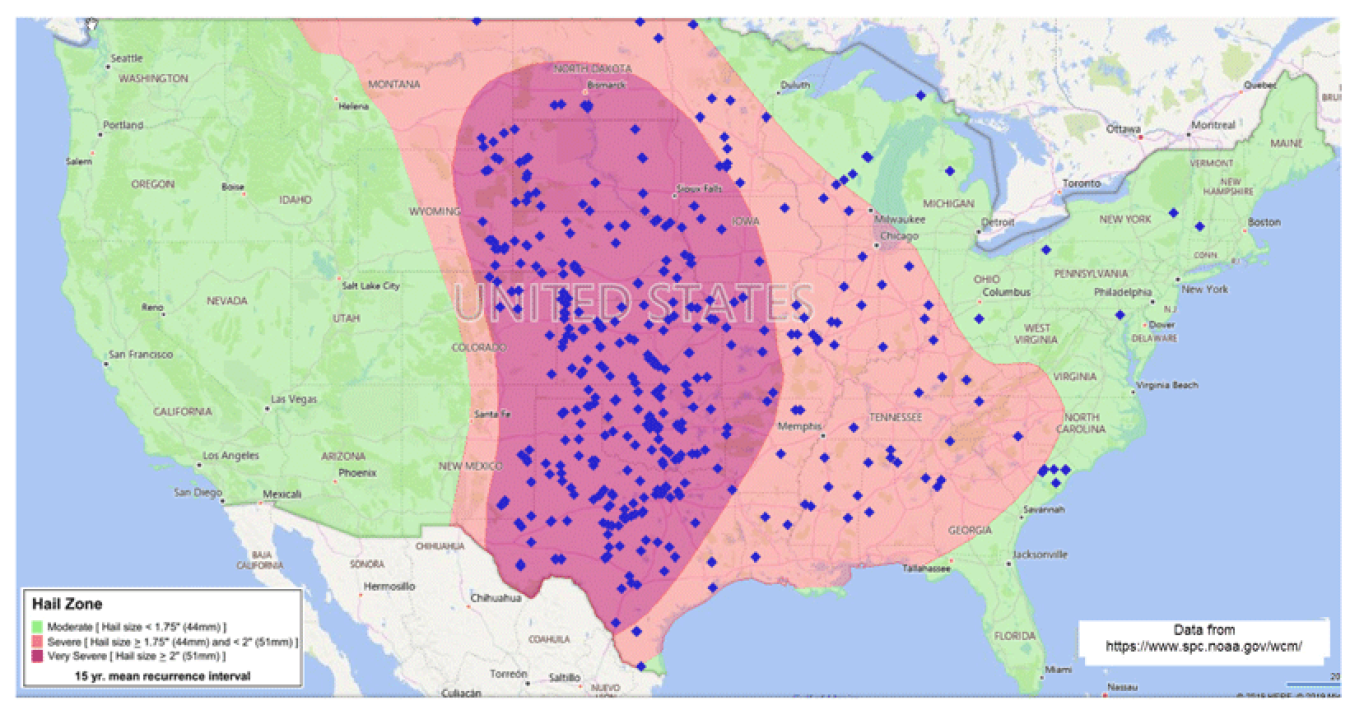
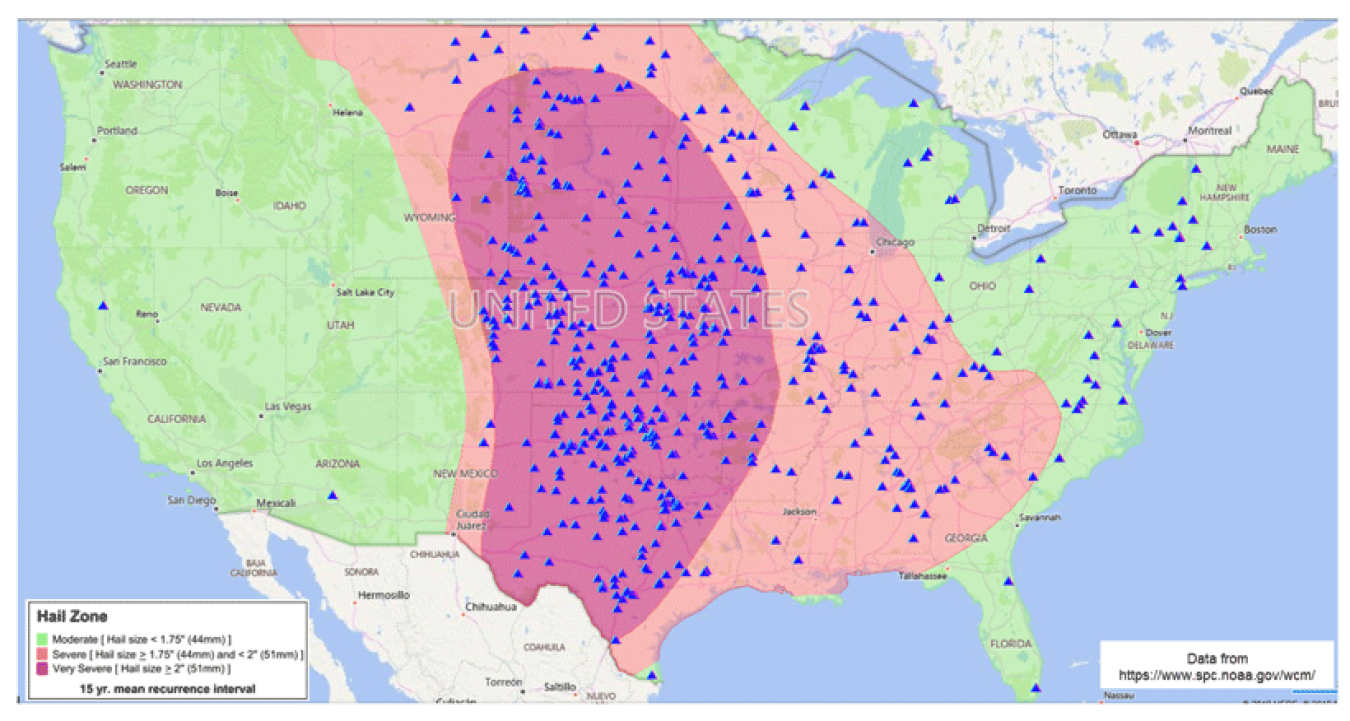
- FM Global also offers risk maps, such as the FM Global Natural Hazards Map, and maps including various sizes of hail. Take the maximum hail mitigation measures in regions prone to very severe hail (i.e., larger than a 2-inch diameter) or likely to experience greater incidence of hail (i.e., greater than 9 days per year of inch+ hail).
Hail risk map for greater than 4 inch hail
Hail risk map for greater than 3 inch and less than 4 inch hail
System Design and Procurement
Proactively designing a system to be hardened to hail is more effective than retrofitting it to be more robust. Hail will primarily impact the modules on a system, so most recommendations for a hail-resilient system involve module selection, though there are broader system design considerations that can also be beneficial.
Glass
Select modules with at least 3.2 mm front glass. These are typically monofacial (not bifacial) modules. 4.0 mm glass is preferred but not common. Glass thinner than 3.2 mm is typically not tempered and rather "heat-treated" which is not as strong. (Watch Kent Whitfield and Cherif Kedir's presentation from the 2021 Photovoltaic Reliability Workshop Oral Presentations).
Certification & Hail Tests
Request that the module manufacturer provide proof of passing a hail test above minimum IEC requirements. In severe or very severe hail-prone areas, IEC 61215 10.17 Hail test basic hail certification is not sufficient. Modules only need to pass a test where they are visually undamaged and lose less than 5% of power from 11 ice-ball strikes at 51 mph of 25 mm diameter (1") hail to be "hail certified."
According to the white paper, Mitigating Extreme Weather Risk, "All PV modules pass [this] product and certification test." IEC offers an optional higher threshold test with higher diameter ice-balls at higher speeds (Table 1). Module manufacturers rarely publish these results, so a specific request is likely necessary.
Table 1. IEC 61215 Hail Certification Tests.
Typically, modules only need to pass the 25 mm diameter tests to claim hail certification. Higher diameter, mass, and velocity tests are optional.Ice Ball Diameter (mm) Ice Ball Mass (g) Velocity (m/s) 25 7.54 23 35 20.7 27.2 45 43.9 30.7 55 80.2 33.9 65 132 36.7 76 203 39.5 Select modules that have passed an advanced hail test such as RETC's Hail Durability Test (HDT), PVEL's Hail Stress Sequence (using 50 mm hail balls followed by other stress testing), or FM Global Standard 4478 (with different certifications for different hail sizes). ASTM E1038 also offers testing criteria for hail from 25-85 mm in diameter that includes an adjustment based on wind speed.
Frame and Support
When choosing between modules, select modules with the stronger frame and, if possible, support bars (including a middle crossbar on the rear side of a module) that provide more support to the module glass. (Wormser, 2020)
Select modules with frames over modules without frames.
Module Type
Select smaller, such as 60-cell modules to limit damage. Large format modules (e.g., 72 or 144 cell modules) may be at higher risk of damage from hail. (GCube, 2021)
Avoid low tilt angles (closer to horizontal). Most damaging hail is heavy and falls more perpendicularly to the ground. Direct impacts perpendicular to a panel surface are the most damaging. Higher tilt angles decrease the chance of this. Compared to a flat panel, tilting panels at 60° can increase the survival likelihood from 82% to 99%, for the tracker system studied in Roedel, 2020. While a 60° tilt is not practical for fixed tilt systems, the higher the tilt angle, the better for hail damage reduction, but the final selected angle will be a compromise between hail considerations, optimizing energy generation, and other factors such as wind loading. Higher tilt angles will experience larger wind load pressures. Higher tilt angles can also compensate for thinner glass. (Whitfield, 2021)
Select a tracker system that can engage in a "hail stow" mode. This stow position is typically the maximum vertical tilt the tracker system allows, which should decrease the angle of impact of most hail balls. It’s better if this automatically engages, but some systems are manually operated. Without implementing special design considerations as discussed in (Reznikov 2018), tracker systems may not fare as well in high wind regions, so certain locations may need to balance these conflicting design considerations.
While design of a system can harden it in the face of hail events, pre- and post-hail event actions can also significantly reduce damage and system downtime.
General Best Practices
Develop a plan for hail events, including how to fund repairs.
Perform a baseline imaging of PV system. Thermal infrared (IR) imaging can be done aerially and reveal cells with different temperatures, indicating a possible problem. Ultraviolet (UV) fluorescence imaging can reveal defects and damage to modules as well and is a relatively new technique. Electroluminescence (EL) imaging is the most revealing for a variety of defects including cell cracks, though is higher cost and takes more time. IR and UV imaging can inform where to focus EL testing (Gabor, 2022). Comparing post-event tests to the baseline helps to identify damage from the event.
For third-party owned and insured systems, understand what hail events are covered under the policy and if there is a cap to claim amounts. Know whether hailstorms are excluded from coverage.
Before a Hail Event
For tracker systems, implement hail stow feature. Some trackers with hail-stow functionality may automatically engage during hail conditions.
If feasible, power down PV prior to severe hail events and inspect before repowering.
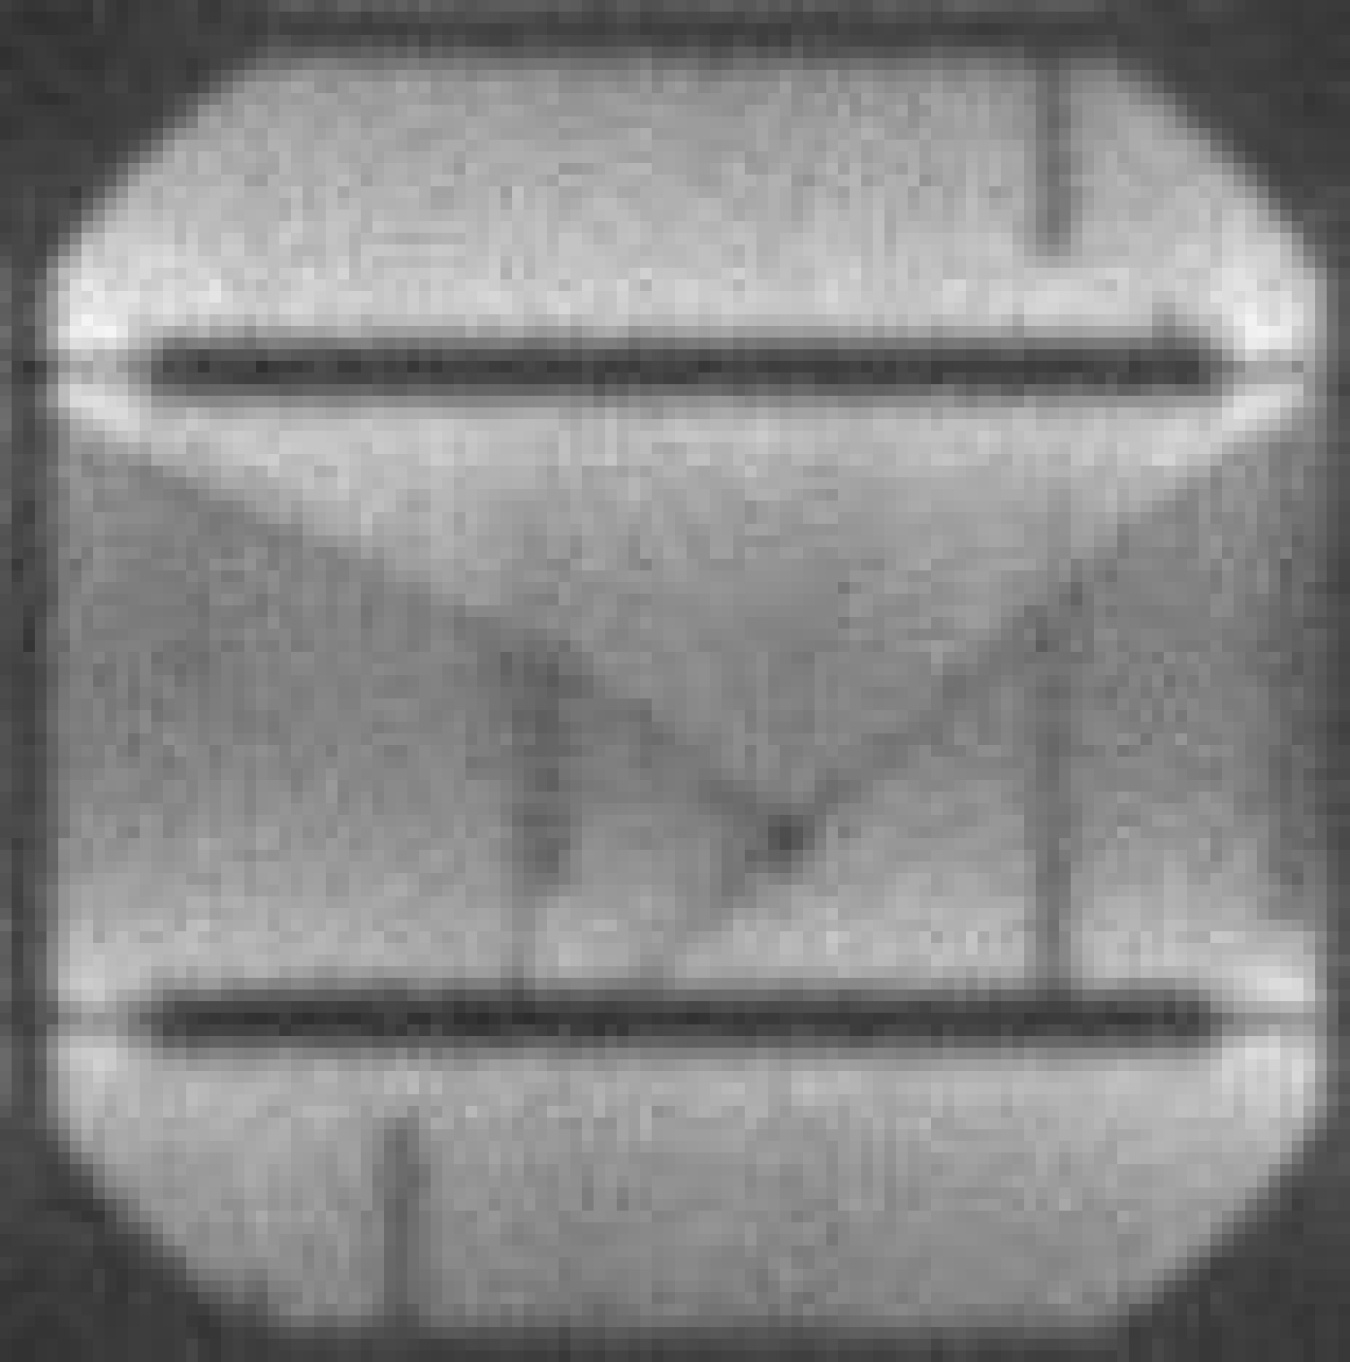 An electroluminescence (EL) image of a PV cell showing cell cracks.
After a Hail Event
If the system suffered visible damage, shut down system until a visual inspection and electrical inspection can be performed.
 Test for electrical faults before repowering the system.
Some damage may be visible while other damage may not be. Perform an IR, UV, or EL scan of panels within one month of the event to look for invisible damage. (Trippel, 2020 and Gabor, 2022) This invisible damage may include microcracks that aren’t initially detrimental but can spread over time, decreasing production and increasing hot spot and fire risk. EL imaging may be necessary to detect microcracks. It is important to test the entire PV system, as hail patterns can be random. (PVEL, 2021)
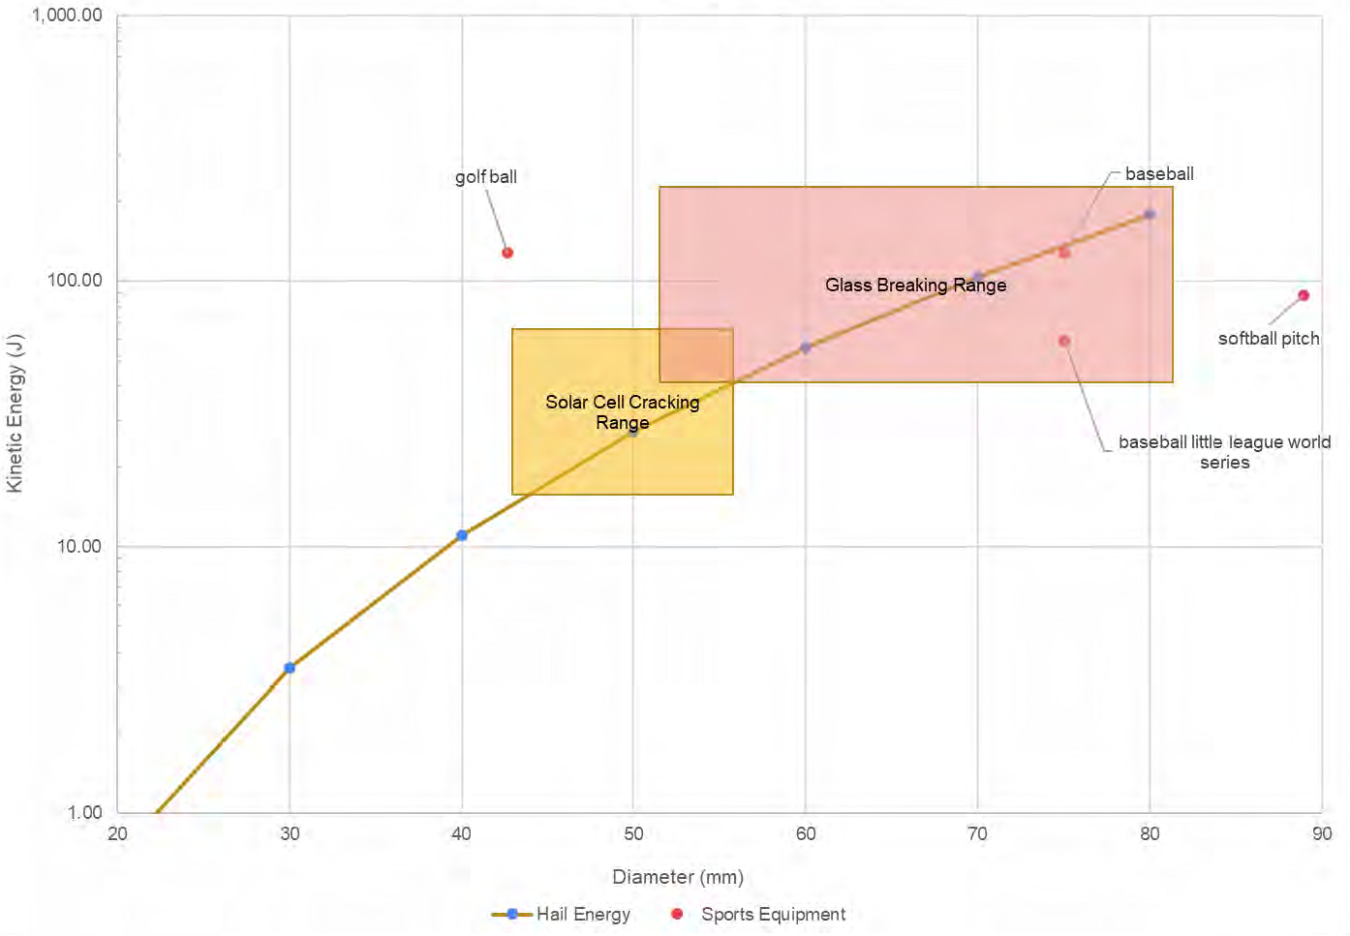 Hail can cause invisible damage through solar cell cracking at hail diameters and speeds less than that which would break the glass.Source: 2020 PV Reliability Workshop