
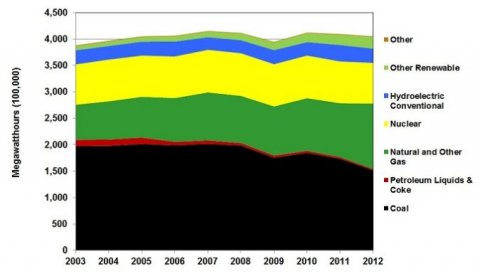
With the increase in market penetration for electric vehicles, the upstream emissions from electricity generation become important. Those emissions are dependent upon the source of electricity generation. Although the generation of electricity varies greatly by region, the overall use of coal declined by about 24% from 2008 to 2012. The decrease in coal use has largely been supplanted by natural gas which has seen an increase of nearly 87% from 2003 to 2012. The use of nuclear and hydroelectric power has remained fairly constant over this time period. Though still a relatively small percentage of overall electricity generation, the use of renewable sources (other than hydroelectric) such as solar, wind, and biomass have increased nearly three-fold while the use of petroleum liquids and coke have dwindled to just 0.6%. The drop in overall electricity generation in 2009 reflects the effects of the economic recession that began at the end of 2007.
Electricity Generation by Source, 2003-2012
Image

Notes:
- Other Renewable sources include wood, black liquor, other wood waste, biogenic municipal solid waste, landfill gas, sludge waste, agriculture byproducts, other biomass, geothermal, solar thermal, photovoltaic energy, and wind.
- Other includes non-biogenic municipal solid waste, batteries, hydrogen, purchased steam, sulfur, tire-derived fuel, and other miscellaneous energy sources.
Supporting Information
| Year | Coal | Petroleum Liquids & Coke | Natural & Other Gas | Nuclear | Hydroelectric Conventional | Other Renewable | Other |
|---|---|---|---|---|---|---|---|
| 2003 | 1,974 | 119 | 666 | 764 | 267 | 79 | 14 |
| 2004 | 1,978 | 121 | 725 | 789 | 260 | 83 | 14 |
| 2005 | 2,013 | 122 | 774 | 781 | 264 | 87 | 13 |
| 2006 | 1,991 | 64 | 831 | 787 | 283 | 97 | 13 |
| 2007 | 2,016 | 66 | 910 | 806 | 241 | 105 | 12 |
| 2008 | 1,986 | 46 | 895 | 806 | 249 | 126 | 12 |
| 2009 | 1,756 | 39 | 932 | 799 | 269 | 144 | 12 |
| 2010 | 1,847 | 37 | 999 | 807 | 255 | 167 | 13 |
| 2011 | 1,733 | 30 | 1,025 | 790 | 313 | 194 | 14 |
| 2012 | 1,517 | 23 | 1,242 | 769 | 272 | 219 | 12 |
| Source: Energy Information Administration, Electric Power Monthly -- June 2013, Table 1.1. | |||||||