
Each vehicle reaches an optimal fuel economy at a different speed or range of speeds. A recent study by Oak Ridge National Laboratory illustrates that point with a wide range of data collected on 74 light vehicles. The figure below shows that from 50 to 60 miles per hour (mph) 26 of the vehicles experienced an 11-13% decrease in fuel economy, but one vehicle only experienced a 5-7% decrease, and two experienced a 17 to 19% decrease. From 60 to 70 mph, a fuel economy decrease of 13-15% was most common, and from 70 to 80 mph, a fuel economy decrease of 15-17% was most common.
Fuel Economy Penalty in Ten-Mile-Per-Hour Increments Notes:
Image

Image
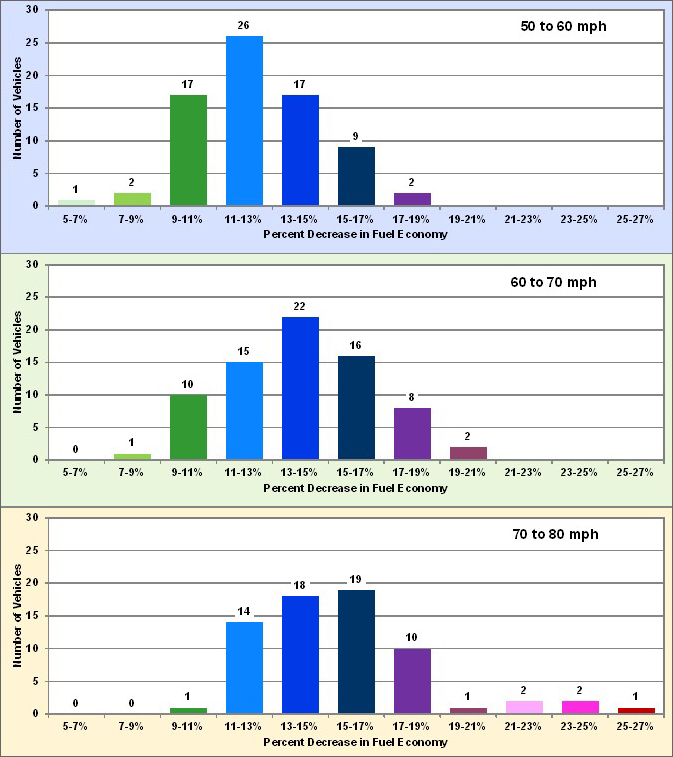
- There were only 68 vehicles used for the 70 to 80 mph analysis; six vehicles were tested only to 70 mph.
- The study included two-seaters, sedans, station wagons, sport utility vehicles, pickup trucks, and minivans of model years (MY) 2003 to 2012 with a wide variety of powertrains.
- Dynamometers were used simulating highway cruising speeds on flat roads with moderate temperatures.
- From 70 to 80 mph, there are several vehicles that show more than a 21% decrease in fuel economy; these values mainly come from vehicles with cylinder deactivation. Cylinder deactivation is a fuel saving technology that allows engines to deactivate cylinders under normal cruising conditions. The switch from using 4 cylinders at cruising speed to 8 cylinders at cruising speed causes a large change in fuel economy.
Supporting Information
| Percent Decrease | Speed Increments | ||
|---|---|---|---|
| 50 to 60 mph | 60 to 70 mph | 70 to 80 mph | |
| Number of Vehicles | |||
| 5-7% | 1 | 0 | 0 |
| 7-9% | 2 | 1 | 0 |
| 9-11% | 17 | 10 | 1 |
| 11-13% | 26 | 15 | 14 |
| 13-15% | 17 | 22 | 18 |
| 15-17% | 9 | 16 | 19 |
| 17-19% | 2 | 8 | 10 |
| 19-21% | 0 | 2 | 1 |
| 21-23% | 0 | 0 | 2 |
| 23-25% | 0 | 0 | 2 |
| 25-27% | 0 | 0 | 1 |
| Total | 74 | 74 | 68 |
| Source: Green Car Congress, "ORNL researchers quantify the effect of increasing highway speed on fuel economy," February 8, 2013. | |||