
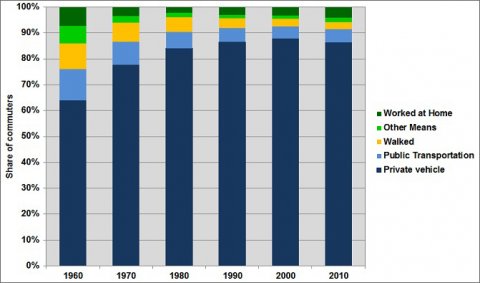
The share of workers who commute to work in private vehicles rose from 64% in 1960 to a high of 87.9% in 2000, but dropped slightly to 86.4% in 2010. The number of people who worked at home continued gaining in share in 2010 to 4.1%. However this number is still less than that reported in 1960.
Share of Commuters by Travel Type, 1960-2010
Image
Image

Supporting Information
| Travel Type | 1960 | 1970 | 1980 | 1990 | 2000 | 2010 |
|---|---|---|---|---|---|---|
| Private vehicle | 64.0% | 77.7% | 84.1% | 86.5% | 87.9% | 86.4% |
| Public Transportation | 12.1% | 8.9% | 6.4% | 5.3% | 4.7% | 5.1% |
| Walked | 9.9% | 7.4% | 5.6% | 3.9% | 2.9% | 2.8% |
| Other Means | 6.8% | 2.5% | 1.6% | 1.3% | 1.2% | 1.6% |
| Worked at Home | 7.2% | 3.5% | 2.3% | 3.0% | 3.3% | 4.1% |
| Total | 100.0% | 100.0% | 100.0% | 100.0% | 100.0% | 100.0% |
| Sources: 1980-1990 data – Provided by the Journey-to-Work and Migration Statistics Branch, Population Division, U.S. Bureau of the Census. 2000 data – U.S. Bureau of the Census, Journey to Work: 2000, Tables 1 and 2, 1990-2000, March 2004. 2010 data – U.S. Bureau of the Census, 2010 American Community Survey, Tables B08301 and S0802. (Additional resources: U.S. Bureau of the Census) | ||||||