
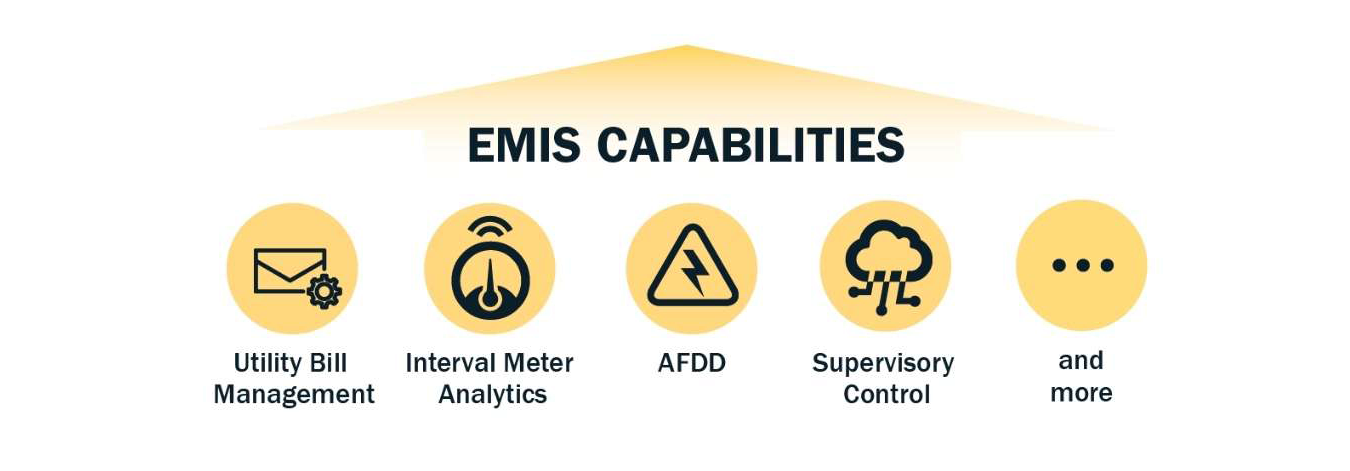
Energy management information system (EMIS) capabilities—outputs that provide value to users—include the following:
- Utility bill management
- Interval meter analytics
- Automated fault detection and diagnostics (AFDD)
- Supervisory control
- Centralize, normalize, and visualize data
- Measurement and verification
- Operations and maintenance optimization.
Learn more about EMIS
Download FEMP's Energy Management Information Systems Technical Resources Report.
Utility Bill Management
EMIS capabilities include tracking, understanding, and processing data from utility bills to help users calculate and visualize whole-building energy consumption over time, as well as compare buildings using monthly utility bill data. Some tools take this further into the management of the bills themselves, offering suites of tools for validation, payment processing, and storage.
A core EMIS function is to graph energy consumption over time and calculate energy-related key performance indicators (KPIs). Utility bill data provides valuable high-level insights, such as how much energy the building uses per year or per month, how much that energy costs, and how it is changing over time.
 A core EMIS function is to graph energy consumption over time and calculate energy-related KPIs.Image Credit: National Laboratory of the Rockies, EnergyCAP
 Cross-sectional benchmarking can be used to compare buildings.Image Credit: Hawai’i Energy
Energy benchmarking is the practice of comparing a building’s current energy performance with its historical performance or with the energy performance of similar types of buildings. Typically, this is done by converting energy usage from utility bills into common benchmarking KPIs, such as energy use intensity (EUI) or energy cost index (ECI).
Longitudinal benchmarking allows the user to visually compare a single building’s performance to its historical performance to track energy savings over time. Given that a large number of federal facilities are located on campuses whose energy usage is rolled up to a single electric and natural gas utility meter, longitudinal benchmarking is often used in the federal sector to track EUI reductions for individual campuses, or at the agency level to track an agency’s progress in meeting federal energy use reduction goals.
 A glidepath is a combination of cross-sectional and longitudinal benchmarking that allows the user to visualize multiple scenarios at once. This can be useful in assessing the agency’s progress toward its energy reduction goals.Image Credit: Lawrence Berkeley National Laboratory
Additionally, two-way integration between the EMIS and ENERGY STAR® Portfolio Manager allows EMIS users to automatically comply with the federal building benchmarking requirements and also use the 1–100 score provided by Portfolio Manager in EMIS benchmarking charts.
Some organizations use an EMIS to perform a variety of accounting-related tasks to process utility bills. Bill validation features allow users to audit utility bills for errors such as incorrect meter readings or charges.
 Example of a billing error discovered using bill validation. This screenshot features software detection of a duplicated invoice number.Image courtesy of EnergyCAP
Payment processing features allow users to streamline accounting processes, such as bill payments and cost reporting, and may include integration with accounts payable software. Budgeting allows for use of historical data to set predictions and budgets for upcoming time periods such as quarters or fiscal years. Internal or tenant billing tools allow users to allocate utility costs among different user groups and produce chargebacks or rebills. In the absence of submeters that show actual usage allocations, bills are typically divided up proportionally by tenant floor area, tenant nominal occupancy, or a similar known proxy metric.
Interval Meter Analytics
EMIS offer a variety of tools specifically designed to analyze meter data at intervals of one hour or less. These "interval data" offer far more granularity than monthly utility bills, and these tools excel at processing all of that extra data in ways that help users find opportunities for performance improvements.
Interval data allow users to enhance utility bill processing capabilities. Advanced utility bill validation features allow the user to compare totalized data from federal advanced metering infrastructure (AMI) meters to the data reported on the utility bill. Advanced internal or tenant billing tools allow the user to allocate utility costs according to the actual usage of buildings, departments, or tenants.
Interval meter visualizations are a well-documented and powerful EMIS feature that helps users analyze energy demand profiles over time. Daily and weekly profiling visualizations are used to understand how energy use changes based on the time of day or day of the week. A 24-hour period is often referred to as a daily profile. Lawrence Berkeley National Laboratory’s Energy Information Handbook provides a detailed primer on how load profiles can be used to uncover three types of performance improvement opportunities:
- Improving equipment scheduling controls and tailoring them to actual building occupancy
- Reducing base loads in offices and similarly operated buildings where the difference in energy demand between the base and peak loads can indicate whether unnecessary loads are running when not in use
- Reducing peak demand usage or utility demand charges.
Heat maps are similar to profiles and are typically used to analyze longer time periods, such as a full year. The advantage of a heat map is the ability to leverage color as a third dimension to present a great deal of data in a very compact space. Heat maps can also be easily combined with heating and cooling degree day data to compare demand data to weather patterns, as shown in the example below.
 An example heat map matched with weather patterns. Heat maps are similar to profiles and are typically used to analyze longer time periods, such as a full year.Image Credit: Lucid Design Group
Some EMIS vendors also offer tools that match daily or weekly profiles to trends from underlying systems, allowing the user to determine the equipment loads that are most significantly impacting usage at the meter.
Another valuable type of interval meter analytics is based on the creation of a mathematical model of expected usage for each meter. The model is then compared to actual usage on a regular basis (e.g., hourly or daily) to uncover various opportunities.
Models are typically formulated using linear regression modeling tools in the EMIS, where the "dependent variable" (i.e., meter usage at a given time), is defined based on the value of the "independent" variables, such as weather or occupancy conditions.
 An example of a single-variable linear regression of electrical demand (kW) as a function of outside air temperature (°F).Image Credit: Bonneville Power Administration
Single-variable change point models, such as those that use a balance point of 65°F, have historically been used to determine when either heating or cooling systems are enabled in commercial buildings. These models have been enhanced into three-to-four-point change models to more accurately predict building energy usage. One example of this type of model is the Whole Building Energy Module, a component of the Whole Building Diagnostician, developed by Pacific Northwest National Laboratory, which tracks total building electrical energy consumption, by end use, via AMI interval data, submetered end-use loads, or equipment-level submetering. It provides a graphical record of building- or system-level performance and usage on a daily basis. The history determines constant variables or fluctuations for different times of the year. Over time, the daily performance history allows the user to identify major changes in energy consumption. The Whole Building Energy Module uses time of day, day of year, day of week, outdoor air temperature, relative humidity, and occupancy to predict and diagnose energy consumption.
Some emerging EMIS features provide automated modeling supported by machine learning, digital twins, or similar statistical modeling packages. These models use recent energy use (generally the last 6–12 months) to keep the model continually updated without intervention from the user.
 An example of a machine learning program that is used to predict building load profiles for the day (shown in light grey), with the actual building load profile shown in light blue, and additional submetered data shown in yellow.Image Credit: Prescriptive Data
Applied interval meter data models are typically used to aid the user in the following capacities:
- Anomaly detection compares metered usage to that predicted by the model. If metered usage surpasses the predicted usage by a certain threshold value, the EMIS notifies the user of an anomaly. Other types of anomaly detection include water leaks, gas leaks, and power outages.
 An anomaly detection algorithm identifies a spike in electric demand.Image Credit: Lawrence Berkeley National Laboratory
- Gap backfilling features allow the EMIS to fill in missing data from the past, which is a common issue with AMI meters. The model determines the expected usage based on the building conditions during the outage and writes the modeled usage to the EMIS database. Note that gap backfilling can also be accomplished without models (e.g., with interpolation). The backfilled data is typically tagged to show the user that it is not metered data.
- Forecasting features use the model, along with a forecast of the independent variables (e.g., weather forecast), to predict the usage over the next 24 hours or several days.
- Measurement and verification, as detailed below.
EMIS can be used to monitor distributed energy resources (DERs) such as photovoltaics, and produce valuable KPIs related to energy production, displaced conventional electricity, and net energy use. Additionally, DER systems can be analyzed to evaluate their overall performance compared to expectations. For example, the performance of a solar array can be evaluated by comparing array output to local solar irradiance data.
 Photovoltaic performance monitoring.Image Credit: National Laboratory of the Rockies, SkySpark
Users can leverage the computational power of an EMIS to create virtual points, including virtual meters. Virtual meters calculate an energy consumption value for end uses such as heating, ventilation, and air conditioning (HVAC) or lighting using static equipment data, engineering calculations, and live data from the equipment. Once individual pieces of equipment have been virtually metered, all similar end uses can be rolled up to determine estimated totals by end use.
Automated Fault Detection and Diagnostics
AFDD is the process of identifying (detecting) deviations from normal or expected operation (faults) and resolving (diagnosing) the type of problem or its location. AFDD is an advanced EMIS capability that uses algorithms to detect equipment- or system-level faults and diagnose their causes. AFDD vastly reduces the time required to find these faults using standard methods, such as trend visualization and analysis. By continuously collecting and analyzing data using rule-based algorithms, the analysis is automated and can be applied to very large data sets on a real-time basis. Several federal agencies such as National Aeronautics and Space Administration and U.S. Army Corps of Engineers also refer to AFDD as condition-based maintenance.
In the buildings industry, AFDD is most commonly conducted for HVAC or critical mechanical systems, but is applicable to all systems in buildings. These tools are used to identify equipment and component failures, performance degradation, system design issues, controllability issues, operator overrides, incorrect sequences of operation, and more. Incorporating AFDD tools can add value to agencies’ operations and EMIS implementations in many ways, including:
- Finding hidden building performance issues that are masked and compensated for by other parts of the system, resulting in no detectable occupant discomfort
- Improving comfort with zone-level diagnostics
- Identifying root causes of HVAC or mechanical building issues.
 Zone-level fault detection and diagnostics.Image Credit: National Laboratory of the Rockies, SkySpark
When AFDD software tools are applied to large buildings or a campus with numerous facilities, the sheer number of identified faults can be overwhelming for facilities staff. Further, some faults are drastically more important to operators than others. Fault prioritization is deployed in many AFDD products and is typically based on the estimated energy cost savings of correcting a given fault. The ability to accurately calculate energy savings and energy cost savings helps to prioritize faults for the building operator and is especially useful when deploying AFDD at scale across a large number of HVAC systems and buildings. The non-energy benefits of correcting faults can also be used for prioritization, including equipment criticality, the size of the equipment, the impact on occupant comfort, and other factors.
 A prioritized list of faults detected.Image Credit: KGS Buildings Clockworks 2020
Supervisory Control
Supervisory control capabilities are an emerging set of features that allow the EMIS itself to make automated changes to underlying building systems. Following are several emerging types of supervisory control offered by EMIS vendors.
Simple supervisory control sequences are deployed in solutions such as the Navy Smart Grid to ensure space temperature setpoint compliance across all Navy buildings on a given base. This strategy is also used to ensure air handling unit start- and stop-time schedules match building schedules. This type of simple supervisory control can be very beneficial for federal energy managers in ensuring buildings are operated to federal standards. This type of supervisory control need not occur automatically.
 Simple supervisory control capabilities feature the ability to turn lights on and off and change the temperature setpoint.Image Credit: Switch Automation
Automated System Optimization is a type of supervisory control that uses a parameter optimization algorithm. Typically proprietary and focused on HVAC systems, it performs analyses on multiple variables and sends commands to the building automation system to optimize both comfort and energy savings. The software continuously adjusts setpoints to satisfy changing building loads in a more efficient way.
 An example of an Automated System Optimization algorithm is chilled water plant optimization, which is designed to reset chilled water supply and condenser water supply temperature setpoints based on real-time conditions at downstream air handling units.Image Credit: Clean Technica and BuildingIQ
EMIS can help support agencies’ demand management initiatives to lower utility costs in two ways: utility-initiated reduction and building-initiated reduction. Utility-initiated reduction occurs when the electric utility sends control signals or requests to the building to reduce demand. This can be accomplished through dedicated protocols that communicate directly with the EMIS or with the building automation system. Building-initiated reduction is when the facility operates equipment assets to deliberately achieve demand reductions and reduce utility costs. Because building-initiated demand management depends on integrated, organized, and accessible data to perform reliably, an EMIS can be a powerful tool for implementing these strategies.
Grid-interactive efficient buildings (GEBs) are an emerging area of interest for federal agencies. Growing peak electricity demand, infrastructure constraints, and an increasing share of variable renewable electricity generation are stressing the electrical grid. Flexible and dispatchable building electricity loads can be used to reduce grid stress. EMIS can interact with the utility grid, sending and receiving signals and initiating supervisory control over end-use systems connected to the EMIS.
GEB can manipulate traditional power-consuming assets like lighting and HVAC, along with on-site resources like rooftop photovoltaics, electric vehicle charging, and battery storage. Depending on the availability of grid data (and associated revenue streams), GEBs can respond to grid needs while providing economic benefits to the agency. Additional benefits from pursuing a GEB strategy can include better system integration and control, increased resilience, and reduced utility costs.
EMIS can be the backbone of the energy efficiency improvements required to set the stage for GEB. Advanced EMIS analytical solutions can also play a significant role in load-changing functionalities (commonly referred to as shed, shift, and modulate) required for GEB.
Another emerging supervisory control capability is the ability for EMIS to automate equipment and system performance tests. Using an EMIS, these tests can be transformed from a manually executed, time-intensive process to an automated process with many benefits beyond time savings, including the ability to test 100% of equipment instead of the industry standard sampling approach that leaves up to 90% of equipment untested. The results of the tests can then be captured and documented using AFDD functionality.
Centralize, Normalize, Visualize Data
An emerging EMIS function is to centralize data streams from different sources to allow for visualization and comparison. This drastically reduces the time required to analyze data and create reports for stakeholders. Advanced visualizations allow users to spot patterns in the data that would be difficult without the help of the software tool.
Centralization, normalization, and visualization of facility data through well-designed user interfaces can boost situational awareness, enable portfolio management via a single interface, and promote energy awareness among building occupants. All of these are enabled by and depend on the well-curated data that an EMIS provides. Important components of centralizing, normalizing, and visualizing data include the user interface, KPIs, reporting, and advanced visualizations.
Learn about implementing standard data tags
Download the Best Practices for EMIS Metadata Schemas fact sheet.
The user interface is designed to allow the user to efficiently navigate, analyze, and interact with EMIS data and represents the core functionality associated with centralizing, normalizing, and visualizing data. User interface designs can vary based on many factors, and some are even configurable by the user. Some organizations prefer the EMIS to look the same for all users, and some vary the look based on the user’s role. For example, an energy manager may care about energy-related metrics, whereas a facility manager prioritizes comfort or operations and maintenance-related metrics.
A primary feature of EMIS user interfaces is the visualization of data using charts—either stand-alone or grouped into dashboards. A dashboard can be customized and arranged according to the needs of the EMIS user. Some vendors even allow users to create their own dashboard design. The following example shows the previous day’s electric usage compared to expectations and the current day’s electric usage, allowing the user to act on any deviations from expectations.
 EMIS dashboards can be customized according to user needs. This example compares the previous day’s electric usage to expectations and the current day’s electric usage, allowing the user to act on any deviations from expectations.Image Credit: MACH Energy
A KPI is a metric that can be tracked and compared to historical or expected values to describe building performance, allowing for prompt corrective action upon identification of system deviations from expectations. While underlying systems, such as building automation systems, can track thousands of points within a building, a KPI combines data from multiple points to provide deeper meaning.
 Summary view of KPIs including air handling unit fan runtime per building, a daily range of building electric demand in kW, and daily building energy usage.Image Credit: SkySpark
Once KPIs are calculated, EMIS software also allows users to overlay them onto dashboards and other visualizations to further aid in discovering opportunities.
 Portfolio-level KPIs can be overlaid onto maps of the portfolio providing a bird’s eye view for all facilities. Here, the largest circles represent the buildings with the highest energy usage per square foot.Image Credit: University of California Davis
Another core function of centralizing, normalizing, and visualizing data is the ability to create reports. Similar to dashboards, reports provide sets of charts or tables in different configurations to meet the user’s needs. Some reporting tools provide the ability to automate the export of reports to external recipients at regular intervals, and many advanced users are using this functionality to replace time-consuming manual reporting requirements.
In addition to customized internal reporting, a specific and increasingly important EMIS reporting function is to process energy data into formats required for corporate or organizational sustainability or greenhouse gas reporting.
Advanced visualizations are tools for centralizing, normalizing, and visualizing data that provide additional insights compared to the typical bar, pie, or line charts. Advanced visualizations are used to drill down into system operations to determine root causes of faults or to verify whether system changes achieved desired outcomes. Advanced time series plots enable the user to combine various data sources (e.g., electrical demand, weather, building operations) to better understand the root cause of unexpected or energy-intensive operations.
 Example of a time series plot combining different data types. This visual provides a clean view of four different types of building automation system points: temperature sensors, a damper output, a fan speed, and a fan’s on/off status.Image Credit: National Laboratory of the Rockies, SkySpark
Scatter plots are valuable for analyzing relationships between system performance and outside air temperature to assess the efficacy of the control of temperature-dependent loads. Further, scatter plots are used to plot system heating or cooling output (load) compared to the energy required to produce that load.
Box and whisker plots show the user how the values in the data are spread out and are useful when comparing many similar pieces of data.
 A box and whisker plot can be used to view the chilled water valve output for every air handling unit over the previous week to look for outliers.Image Credit: Talisen Technologies
Measurement and Verification
Measurement and verification capabilities allow EMIS users to quantify and verify the energy savings performance of individual energy conservation measures or efficiency projects. These tools use data from monthly utility bills, interval meters, and building automation systems, and typically include some form of reporting functionality.
The International Protocol for Measurement and Verification (IPMVP) was created to encourage consistency in how savings calculations are performed. It details the principles, methodology, options, and measurement and verification plan requirements for compliance. EMIS tools are designed to facilitate and automate the statistical and mathematical calculations inherent to each of the options. While all options are technically possible to execute using EMIS, IPMVP Option C: Whole Facility is the approach most commonly provided by EMIS vendors.
IPMVP Option C requires the creation of a mathematical model of "baseline" usage, which describes how the building operated in the past. Models are typically formulated using linear regression modeling tools in the EMIS, where the "dependent variable" (i.e., meter usage at a given time), is defined based on the value of the "independent" variables, such as weather or occupancy conditions. The projected usage from the baseline model is then compared to actual usage and the difference is the avoided usage, or savings.
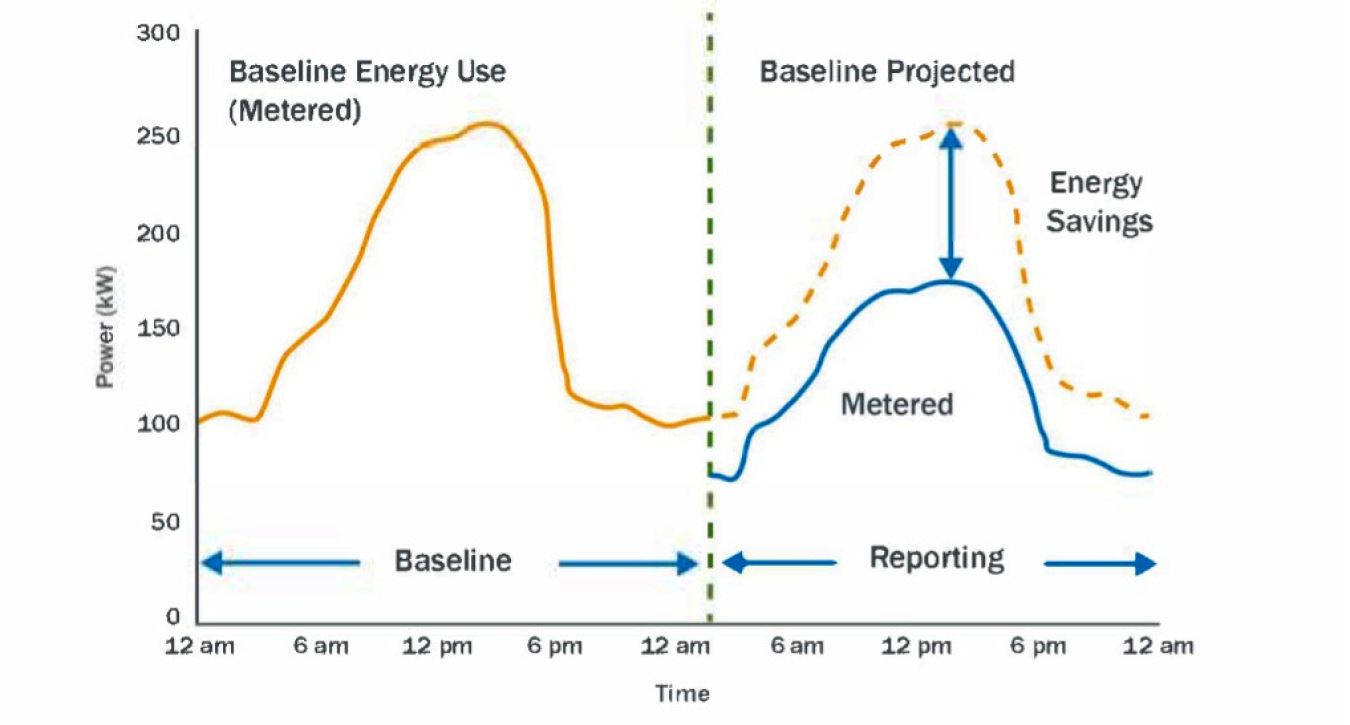 Annotated example comparing projected to actual usage.Image Credit: Lawrence Berkeley National Laboratory
As AMI meters have increased in prevalence, some EMIS vendors have added advanced measurement and verification capabilities, taking advantage of the increasing granularity of available meter data. These enhancements can benefit EMIS users in many ways, including providing early warning signs of savings degradation and offering more actionable insights.
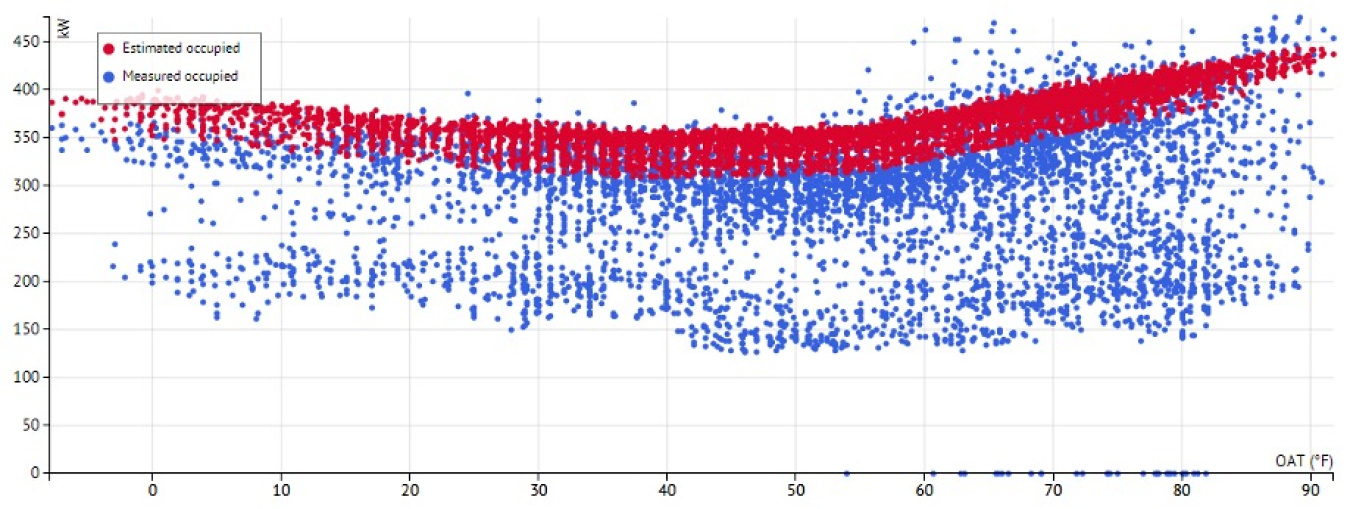 Interval data displaying an hourly estimate of the baseline usage (red) overlaid with the actual hourly usage (blue), indicating significant electric savings.Image Credit: KW Engineering
Another key measurement and verification activity is operational verification—making sure energy conservation measures are installed, commissioned, and performing as intended. EMIS users can utilize visualization and analytics tools to review system operational data and verify performance across all modes of operation.
Operations and Maintenance Optimization
EMIS software is most effective when closely integrated with an effective Energy Management System like DOE’s 50001 Ready and other operations and maintenance processes. Many EMIS vendors offer tools or assistance to help support this integration. These tools increase the efficiency of operations and maintenance in three primary ways:
- Simple issue tracking
- Connecting to a computerized maintenance management system to communicate work order information
- Generating predictive or condition-based maintenance recommendations.
Learn how to plan an effective EMIS operational process
Download the Best Practices to Support EMIS Operation at Federal Facilities fact sheet.
As opportunities for performance improvement are identified using EMIS, the Energy Management System team can make sure the "people" side of the action is completed and can be managed through to resolution using built-in issue tracking capabilities. Users can assign the issues to an owner, such as operations and maintenance staff or external service providers. Typically, once assigned, all stakeholders can interact and discuss the issue through comments until the issue is closed. Other options include mobile support, email subscriptions for updates to issues, and the ability to filter the list of issues by metadata such as assignee, equipment, or issue type.
 As opportunities for performance improvement are identified using EMIS, the Energy Management System team can make sure the action is completed and can be managed through to resolution using built-in issue tracking capabilities.Image Credit: Switch Automation
An additional EMIS capability is integration with the agency’s computerized maintenance management system software. Users have the ability to set up automated or manual work orders from within the EMIS, which are pushed into or pulled from the computerized maintenance management system software for resolution. Further, if two-way communication between the two systems is established, EMIS users can receive feedback on the work order completion to help streamline issue tracking.
Additionally, data visualization and KPI capabilities inherent to EMIS can be used to provide summaries of operations and maintenance data, such as tracking and time estimates for maintenance, time between failures, time for replacement, and downtime of active devices. A benchmarking analysis by device, building/utility, or region can be used to draw comparisons to standards or other buildings within the agency.
Traditionally, operations and maintenance staff have practiced either calendar-based maintenance, where there is a fixed schedule, or reactive maintenance, where equipment is repaired or replaced only after failure. Condition-based maintenance (or monitoring) and predictive maintenance practices enable more proactive, informed decisions by detecting the onset of performance degradation and allowing the user to correct the issue prior to failure or detection by building occupants. An emerging EMIS capability uses equipment data collected from underlying systems and integrated computerized maintenance management system to generate these recommendations. Common examples include the following:
- Analyzing the differential pressure across a filter in an air handling unit can alert staff when filter replacement is required, rather than changing the filter out at some predefined interval, as is standard with preventive maintenance.
- Detection of a reduction in heat transfer across a heat exchanger, calculated using the difference between temperature sensors, can assist in the scheduling of tube cleaning or a modification to chemical control measures.
- Detection of system parameters operating outside of their normal operating ranges using Advanced Pattern Recognition and machine learning technology enable the application to learn the unique operating profile for each asset during all loading, ambient, and operational process conditions.
Due to increased digitization of facilities, much of the equipment installed already features instrumentation that can be used to provide the data required for the above analyses. Where the instruments are not present, sensors can be installed and integrated with EMIS.
Insight into real-time performance of building equipment enables maintenance programs to be conducted based on the current or predicted performance of that equipment, benefiting the agency with reduced equipment failure rates, avoided labor costs, and avoided unnecessary maintenance.