The U.S. Department of Energy’s National Community Solar Partnership tracks progress toward the goal of expanding access to affordable community solar to every American household. One of the ways this is accomplished is by gathering and analyzing community solar project data in three categories:

  • Access to community solar projects by state, looking at where they are installed and how much capacity exists;
  • Affordability of community solar subscriptions for residential subscribers; and
  • Progress states are making on including low-income access in their community solar programs.

This community solar market tracking effort, called Sharing the Sun, is conducted by the National Renewable Energy Laboratory (NREL). You can access to the complete project dataset and associated presentations and fact sheets on the Community Solar Resources webpage and on NREL’s Community Solar webpage.

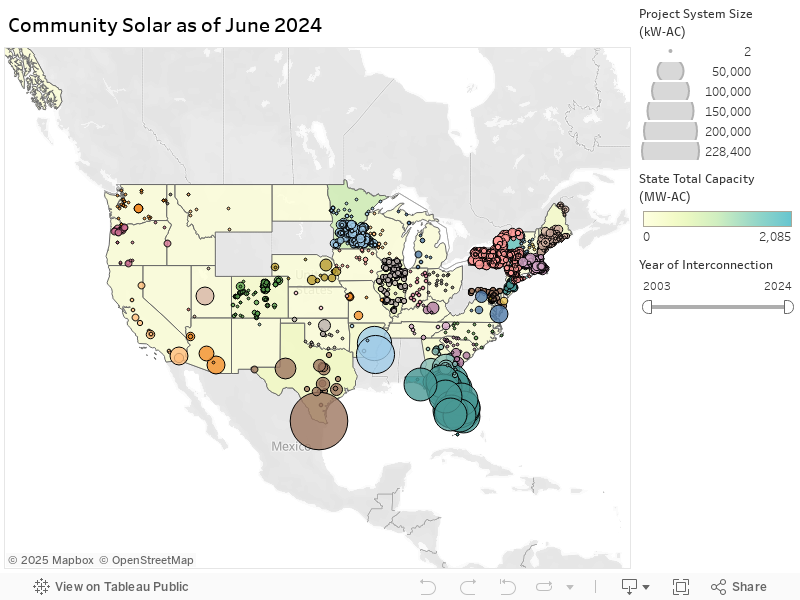
Access to Community Solar Projects

As of December 2021, community solar projects are located in 40 states, plus Washington, D.C. Nearly three quarters of the total market is concentrated in four states: Florida (1,636 megawatts alternating current (MW-AC)), Minnesota (834 MW-AC), New York (731 MW-AC), and Massachusetts (674 MW-AC). The National Renewable Energy Laboratory's Status of State Community Solar Program Caps report has more state-level information on community solar access.

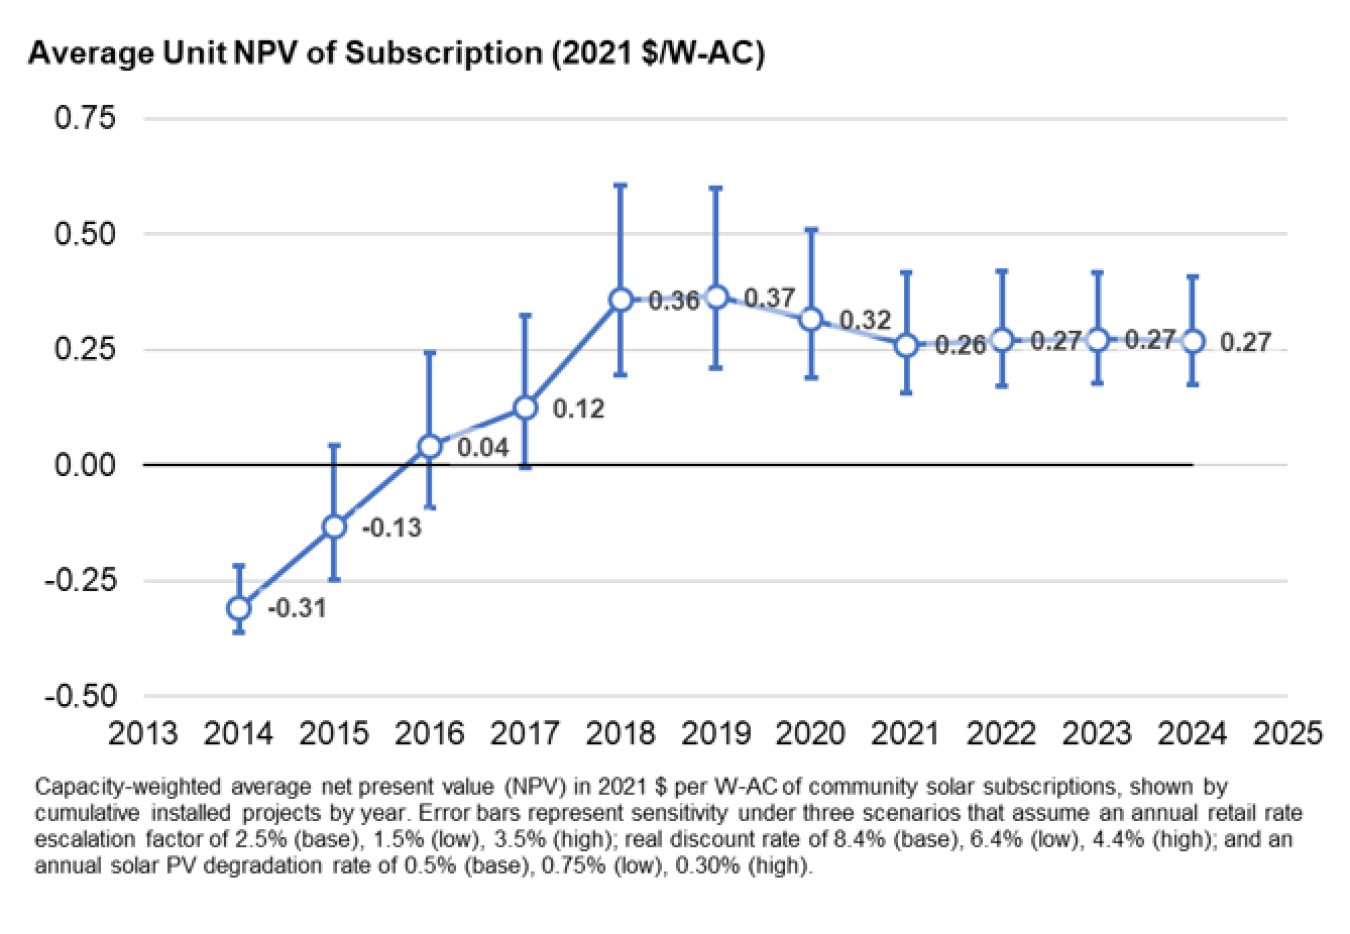
Savings from Community Solar Projects

The  Department of Energy examines the affordability of community solar through the net present value (NPV) of a residential subscription, which measures the difference between the credits received and payments that subscribers make over time. A positive NPV means subscribers are saving money over the life of their subscription, as compared to not subscribing. The median project-level NPV is about +$0.19 per watt (W) as of December 2020 (sensitivity range: +$0.16/W to +$0.25/W). About 76% (sensitivity range: 75-79%) of projects yield a positive NPV, meaning most projects result in positive net benefits to the customers over the course of the subscription. Learn more about the methodology.

This chart shows how community solar has become more affordable from 2012 to 2019.

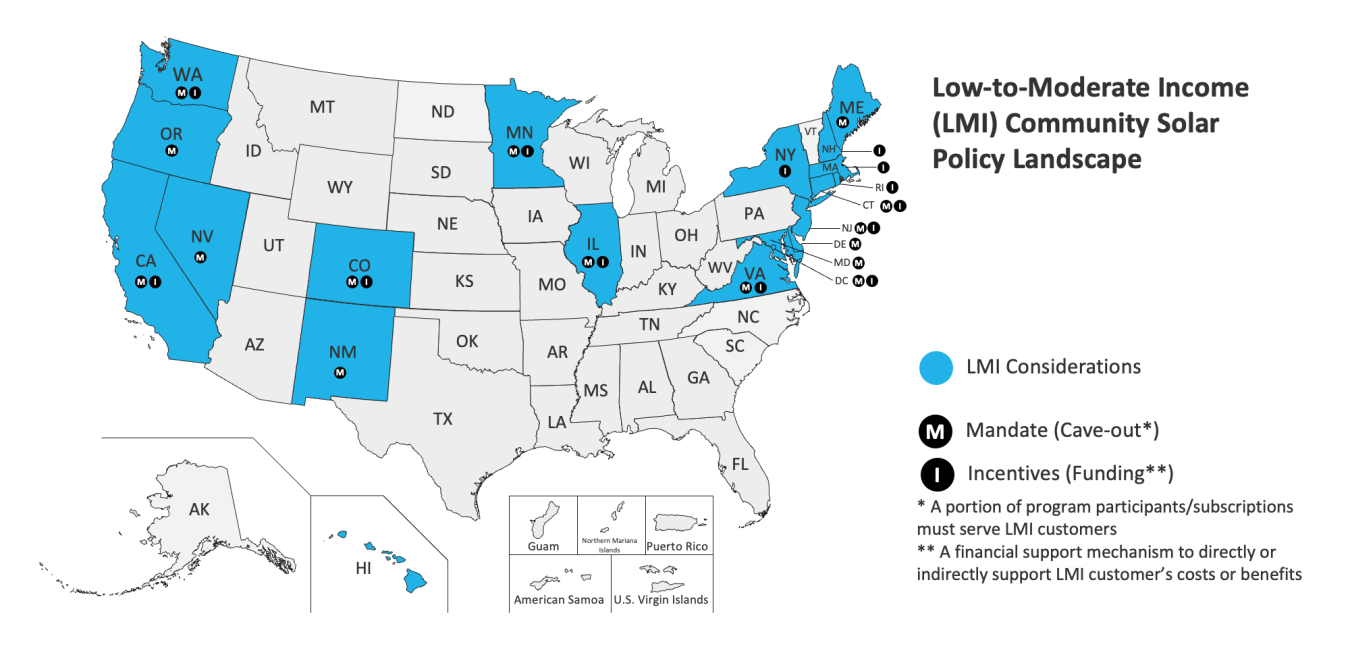
Efforts Targeted at Low-Income Access to Community Solar

As of June 2022, 22 states and Washington, D.C. have enacted legislation that enables or requires community solar. Of that group, 17 have created provisions to address low-income participation in community solar. State government incentives provide additional funding for projects that subscribe low-income customers; some states have mandates called carve-outs that require a certain percentage of a community solar project or program to be subscribed by low-income subscribers or low-income serving organizations.

National Community Solar Partnership State Policy Map

Breakdown of Low-Income Community Solar by State

State
LMI Funding/Incentive
LMI Carve Out
Total Capacity
LMI Capacity (if carve out)
CO $800/kW grant 5% capacity; plus utility-led dedicated LMI program Uncapped 41 MW (Pivot energy)
CT No 80% of output (20% of output to low-income customers, 60% to combination of LMI customers or customers who qualify as low-income service organizations) 225 MW 180 MW
DC FY22 $20 million for SFA - waiting on confirmation 100,000 customers 42 MW 30-60 MW (DC indicates all projects are dedicated to low income customers)
FL Unsure 37.5 MW dedicated 1,490 MW (FP&L phase 1); 1,830 MW (FP&L phase 2); 750 MW (Duke Energy) 37.5 MW (FP&L phase 1)
HI To develop incentive for phase 2 Require to develop carve-out for phase 2 8 MW (phase 1), 235 MW (phase 2) N/A
IL $26.3 million for ILSFA CS in Program Year 2021-2022 ($62-$122/REC upfront payment) Specific funding that applies to LMI Community Solar 400 MW (by 2030) Incentive levels vary by individual project capacity
MN No 5% of project capacity Uncapped N/A
NH 2 projects/territory/year ($0.025/kWh adder) Projects must directly benefit at least 5 residential end-user customers, majority of which are LMI N/A N/A
NJ No 40% of Year 1 projects need at least 51% subscription levels; 51% of Year 2 projects need at least half LMI subscription levels 78 MW year 1, 165 MW year 2 31.2 MW (year 1), 84.15 (year 2)
NM Unsure 30% of each project 200 MW 60 MW
NV No 25% of customers 10 MW (calculated) N/A
NY

$387 million dedicated to the Solar Energy Equity Framework (SEEF) in addition to capacity-based incentives for distributed solar projects. Key initiatives include the following:

  • Solar for All: electricity bill credit for low-income New Yorkers via community solar.
  • Expanded Solar for All (E-SFA): electricity bill credit for participants in National Grid’s Energy Affordability Program.
  • Inclusive Community Solar Adder: additional incentive for community solar projects, which dedicate at least 20% of capacity to disadvantaged communities
The Climate Leadership and Community Protection Act (CLCPA) mandates that at least 35% of the benefits of funding must go toward disadvantaged communities. The SEEF details the different programs to direct the benefits from distributed solar toward LMI customers and disadvantaged communities. 10 GWdc of distributed solar by 2030. It is anticipated that over 1,600 MWdc will be targeted towards LMI residents, regulated affordable housing, and disadvantaged and environmental justice communities. However, there is no cap on LMI capacity.
OR Require that LI customers receive either 20% or 40% savings on their subscriptions depending on project type through cross-subsidization. 10% of each project (10% total capacity) 160 MW 16 MW for first tier
RI $500/subscriber grant No 60 MW N/A
SC No 400 kW each program 3 MW (DEC), 1 MW (DEP) 0.8 MW
VA No 30% Dominion; 50% of all programs 150 MW (Dominion) 45 MW (Dominion)
TOTAL       1,636.5 MW