
3D hydrogeological visualizations bring data analysis to life - For LM e-newsletter
January 16, 2020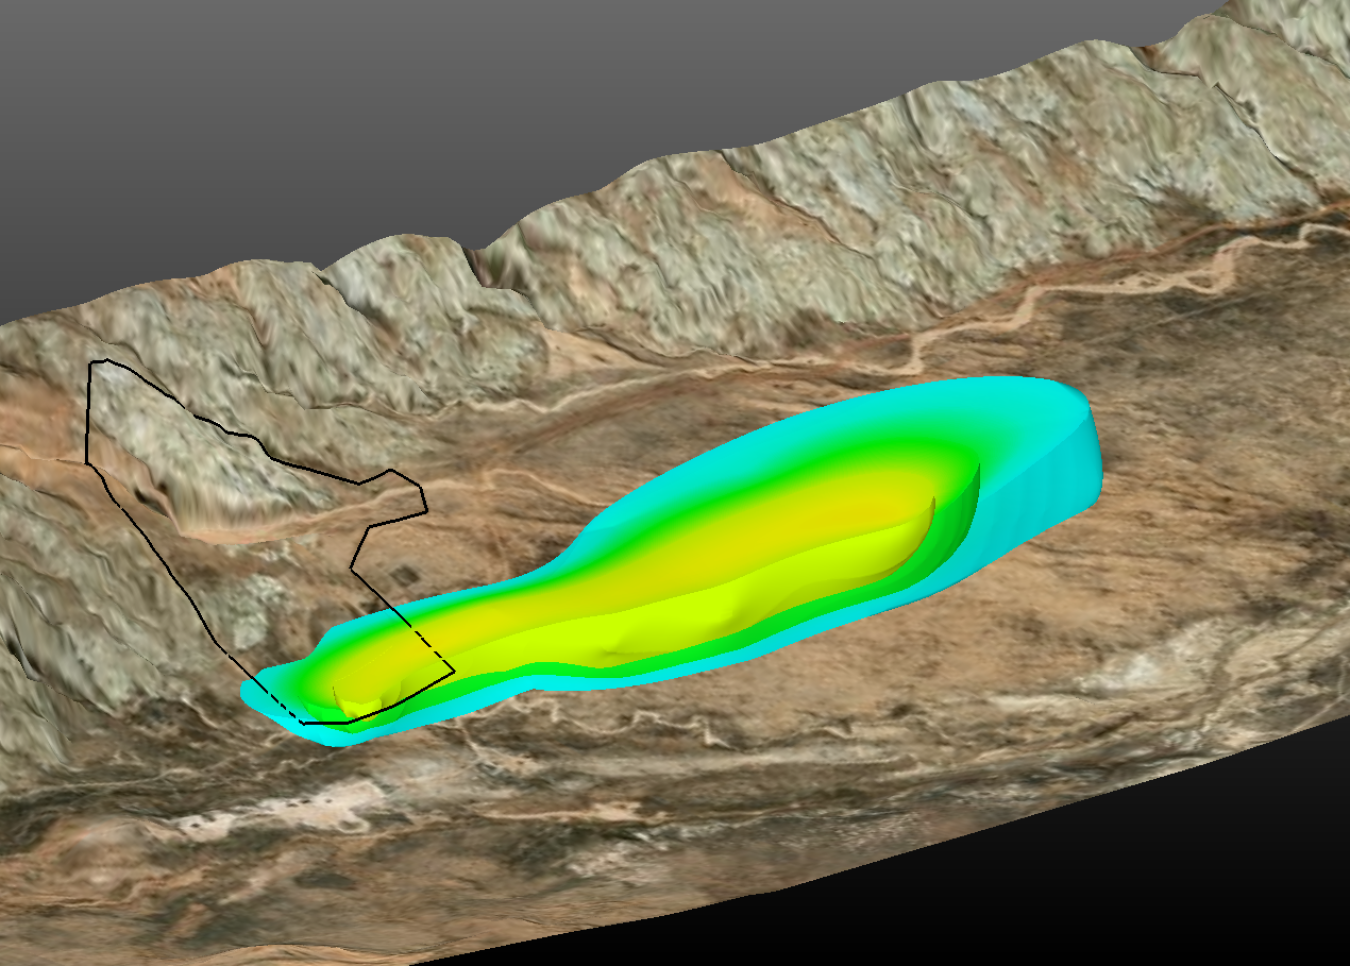
A screen capture shows an EVS visualization of the nitrate plume at LM’s Monument Valley, Arizona, Site from December 2018.
A three-dimensional model of the groundwater plume beneath the Monument Valley, Arizona, Processing Site dances on Ron Kent's computer screen. With a click of his mouse, Kent, a contract groundwater hydrologist in the U.S. Department of Energy (DOE) Office of Legacy Management (LM), can rotate the visualization, zoom in and out, and pan through the site. The data-rich model lets him analyze how the plume is changing over time and evaluate site monitoring activities.
"These visualizations enable us to perform analyses that are difficult to do otherwise," Kent explains. "We can synthesize decades worth of data, calculate the mass and footprint of a plume, and learn more about plume dynamics – is a plume shrinking, or growing?"
The LM Support (LMS) Groundwater and Geochemistry Group began using Earth Volumetric Studio (EVS), the software behind these visualizations, in 2017. With EVS, the team is able to create visualizations and animations of geology, groundwater, and contaminants of concern at LM sites in a user-friendly package that is applicable to both scientists and stakeholders.
"It’s been very visually helpful and useful in communicating groundwater site conditions with our stakeholders,” says Angelita Denny, the DOE Office of Legacy Management (LM) site manager for Monument Valley.
In addition to Monument Valley, the team has created visualizations for a handful of other LM sites, including Shiprock, New Mexico; Tuba City, Arizona; Riverton, Wyoming; and Naturita, Colorado.
"There is an initial investment up front as you need to input all the data, but then it's seamless to update," says Al Laase, who heads the Groundwater and Geochemistry Group.
Laase emphasizes the value that the visualizations bring to LM's mission of long-term stewardship. "We get a tremendous amount of information from the analysis of a 3D plume, and this analysis can change our interpretation of a site," he says.
The visualizations are lending themselves especially useful to LM's communication, education, and outreach efforts. Staff have presented them to stakeholders at the Navajo/Hopi/DOE quarterly meetings. They've also demonstrated the visualizations at a handful of STEM (Science, Technology, Engineering, and Mathematics) outreach events, ranging from high schools on the Navajo Nation to the 2018 American Indian Science and Engineering Society conference. Using a mouse, students and others at these events were able to "fly" around a 3D plume map overlain on aerial imagery of LM sites.
"EVS is a great tool that I hope to integrate into more sites that I manage,” Denny says.
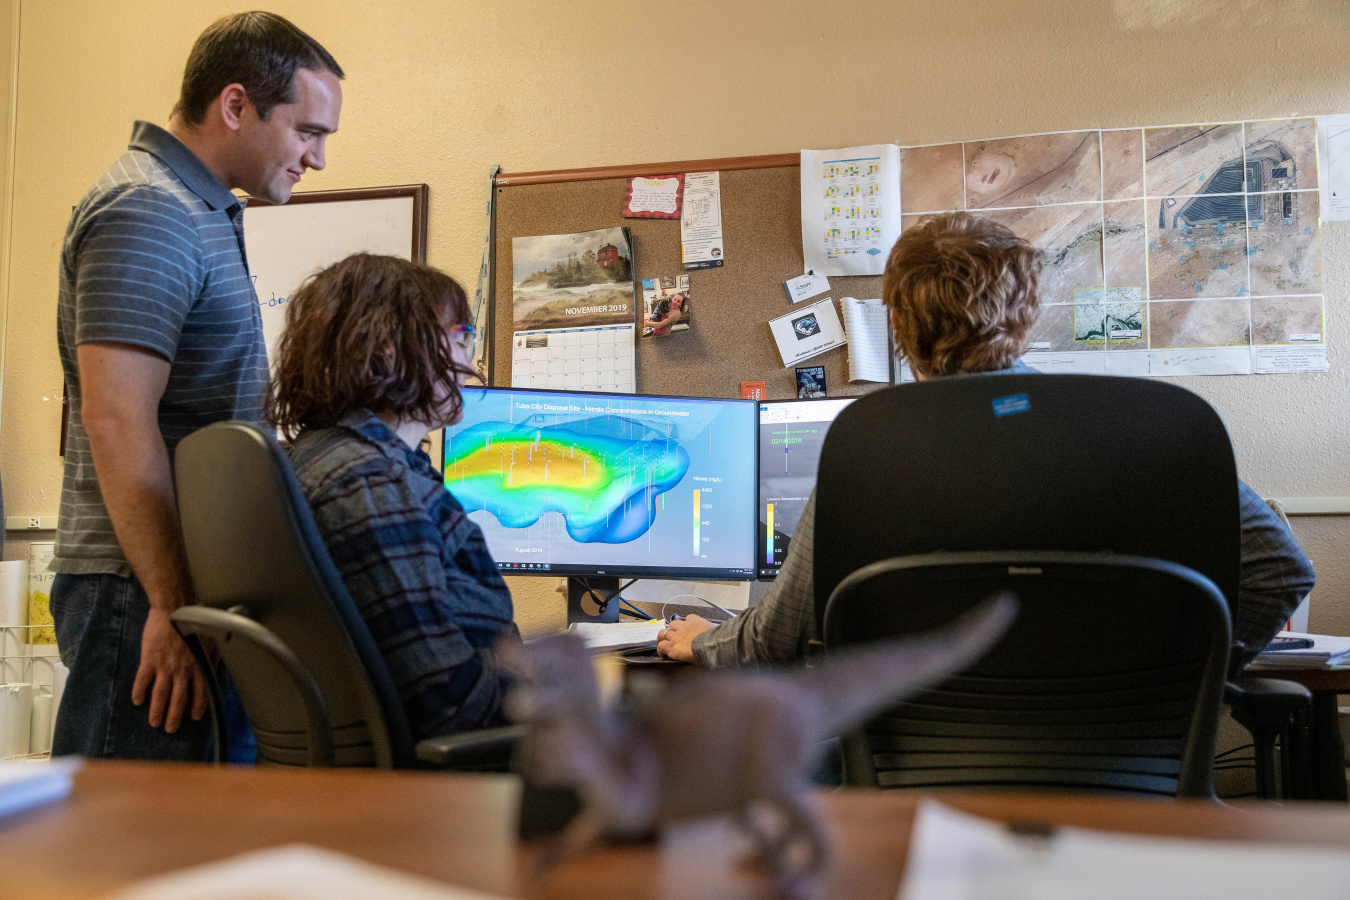
Ron Kent, Allison Reynolds, and Mike Morse from LM Support collaborate on a hydrogeological visualization using Earth Volumetric Studio.