
In some markets, wind power is having significant impacts on the timing and location of electricity prices.
Integrated Energy Systems Office
June 1, 2020In some markets, wind power is having significant impacts on the timing and location of electricity prices
This article is part of the
Wholesale electricity prices have fallen dramatically in most organized markets in the United States over the last decade, contributing to an increase in the retirement of thermal power plants. The price drops are largely because of a steep reduction in the price of natural gas. But growth in wind and solar generation, fairly flat trends in electrical load (demand), and new natural gas power plant capacity have also played a role.
A new report from DOE’s Lawrence Berkeley National Laboratory analyzes the drivers of price changes using two approaches. First, price dynamics between 2008 and 2017 are assessed using a supply curve model. Second, hourly wholesale prices at more than 60,000 pricing nodes are used to highlight the impacts of wind, solar, and other factors on geographic and temporal pricing patterns.
The report, “The Impact of Wind, Solar, and Other Factors on Wholesale Power Prices: An Historical Analysis—2008 through 2017,” finds that falling natural gas prices were the dominant driver of overall marketwide average price drops, reducing average annual wholesale prices by $7–$53 per megawatt-hour (MWh) over the last decade. The biggest declines were found in New York and New England, but reductions were substantial across all regions.
As shown in Figure 1, a second tier of factors includes wind and solar generation; expansion and retirement of thermal generation; changes in demand; generator efficiency; coal prices; variations in hydropower; and certain other prices. An interactive version of data from the report is available online.
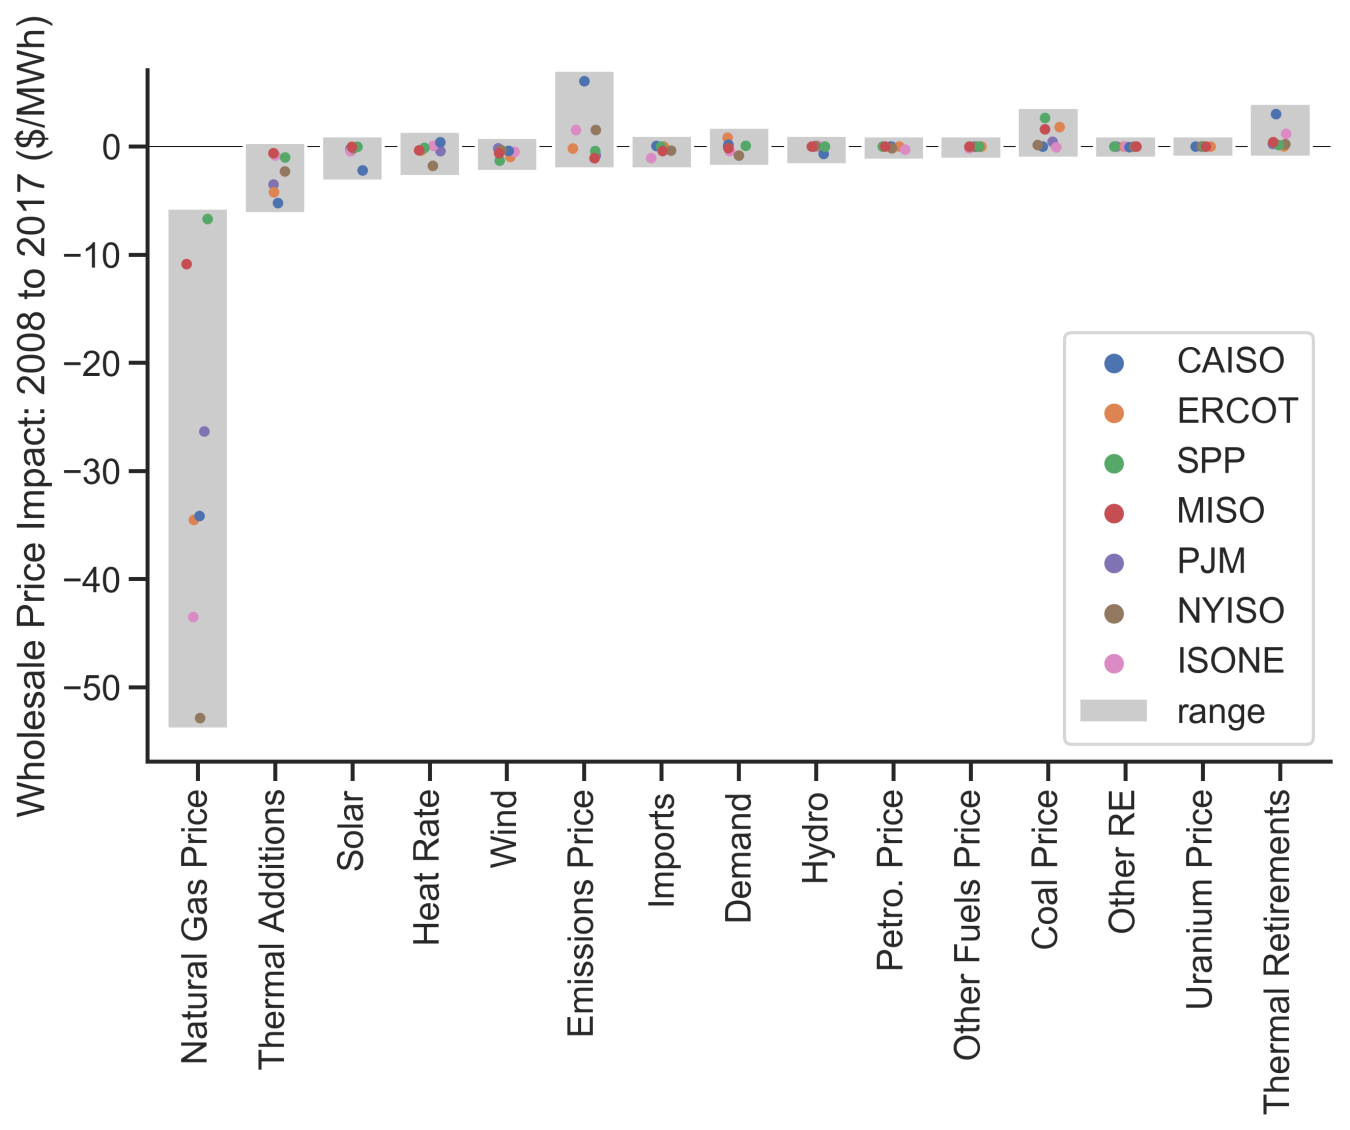
Figure 1. Average wholesale power energy price impact of various factors that changed between 2008 and 2017 across all organized wholesale power markets in the United States. Figure: LBNL
In most markets, growth in wind and solar reduced average, marketwide wholesale prices by less than $1.30/MWh over this period, although California was an exception, with solar reducing prices by $2.20/MWh. This may foreshadow greater impacts from solar in other regions as solar penetrations grow.
The analysis also looked at the impact of wind and solar on prices in specific times and places. Growth in wind and solar impacted time-of-day and seasonal pricing patterns and the frequency of negative prices, especially in areas with high levels of wind and solar and in the presence of transmission constraints (Figure 2).
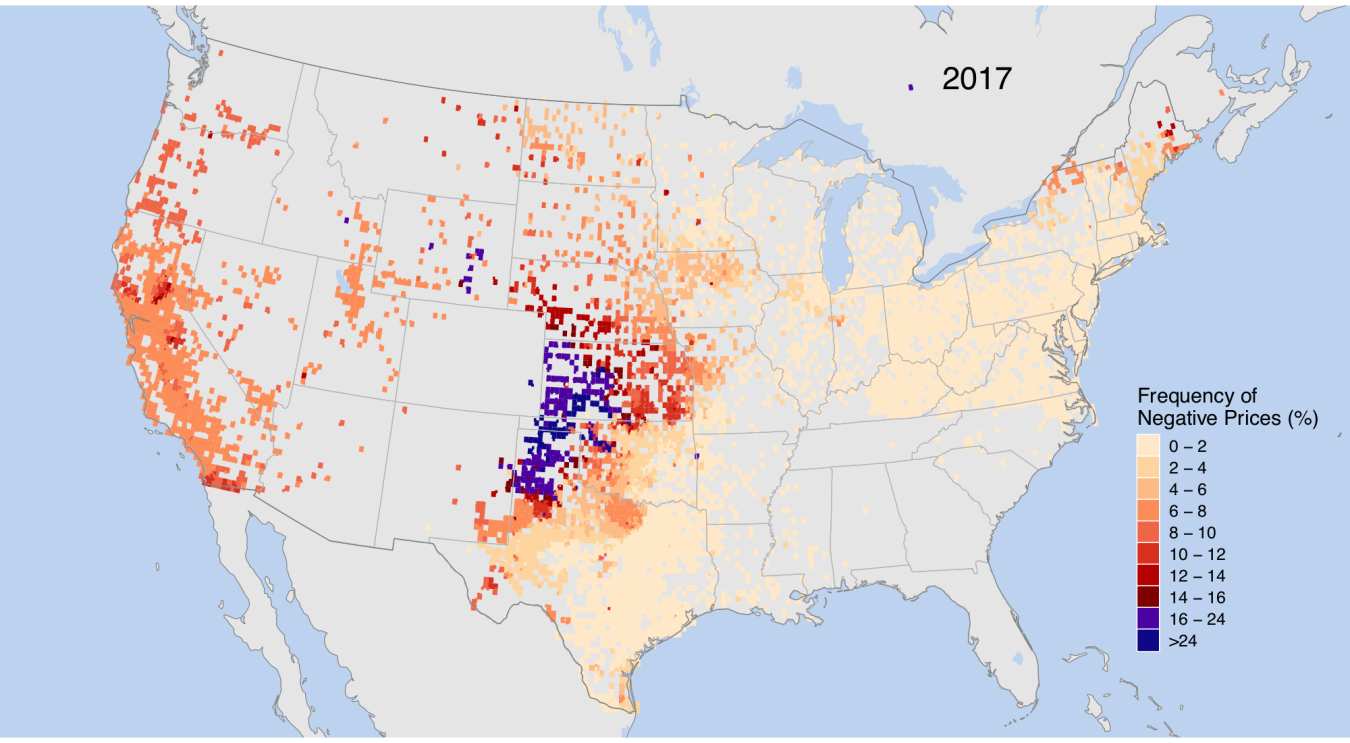
Figure 2. Frequency of negative locational marginal prices (LMPs), or real-time power prices, in 2017. This analysis determined that areas with high levels of wind and solar increased the frequency of negative prices. Figure: LBNL
Although negative price events are becoming more frequent, they vary widely by location and from year to year. Also, they have been mostly small in magnitude and have not heavily impacted annual average prices at most locations. Their biggest impact has been in parts of the Midwest in the Southwest Power Pool; in California; and in the northern areas of New York, New Hampshire, and Maine.
In 2017, negative prices decreased the average annual real-time energy price at nodes near wind power plants by about 6%, at nodes near solar plants by about 3%, and nodes near hydropower plants by about 3%. Pricing nodes near coal, gas, and nuclear plants saw a smaller reduction of about 1.5%, though those modest impacts have slightly increased over time.
Wind and solar power are just two of numerous factors that influence local pricing patterns but can be significant contributors to locational, time of day, and seasonal pricing patterns in some regions. Recent thermal-plant retirements in the United States are primarily the result of low natural gas prices, not growth in wind and solar.
These altered pricing patterns hold important implications for the grid-system value of wind and solar and related policy considerations, as well as for a host of other electric-sector operating, planning, and policy decisions related to transmission expansion and flexible supply, demand, and storage resources.
Spring 2020 R&D Newsletter
Explore previous editions of the Wind R&D Newsletter or browse articles by topic: