The U.S. Department of Energy’s National Community Solar Partnership tracks progress toward the goal of expanding access to affordable community solar to every household in the United States. One of the ways this is accomplished is by gathering and analyzing community solar project data in three categories:
- Access to community solar projects by state, looking at where they are installed and how much capacity exists;
- Affordability of community solar subscriptions for residential subscribers; and
- Progress states are making on including low-income access in their community solar programs.
This community solar market tracking effort, called Sharing the Sun, is conducted by the National Renewable Energy Laboratory (NREL). You can access the most recent project dataset and associated presentations and fact sheets on the Community Solar Resources webpage and on NREL’s Sharing the Sun webpage.
Access to Community Solar Projects
As of June 2024, there is approximately 7.87 GW of community solar in operation in the U.S. These community solar projects are located in 44 states and localities, including the District of Columbia. Over three quarters of the total market is concentrated in four states: Florida, New York, Massachusetts, and Minnesota. The National Renewable Energy Laboratory’s Sharing the Sun Community Solar Project Dataset has more state-level information on community solar projects, including a catalogue of additional community solar capacity currently being planned (but not yet in operation) that will serve low- to moderate-income households.
Savings from Community Solar Projects
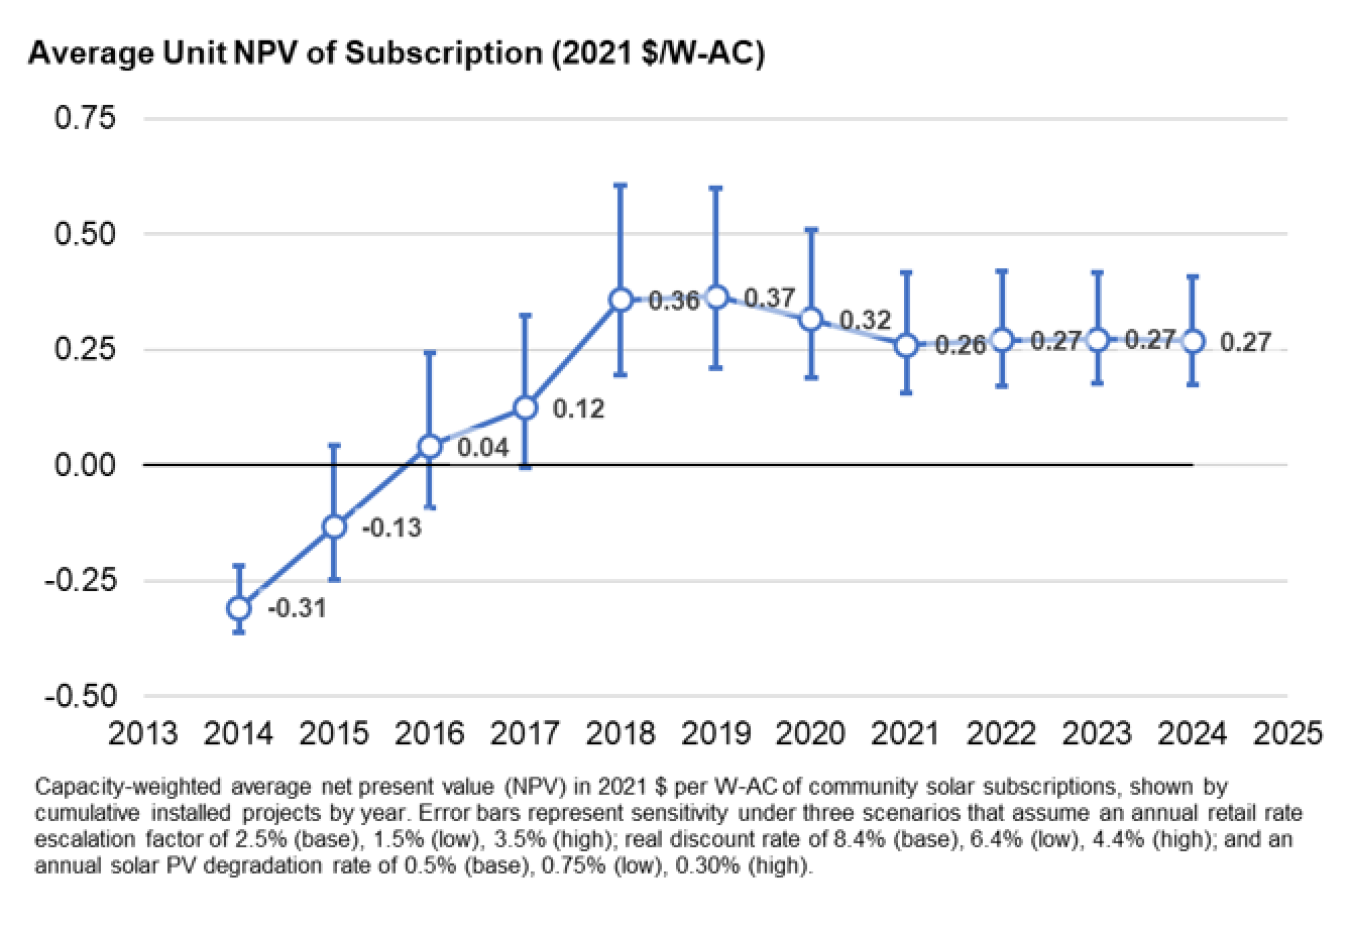
The Department of Energy examines the affordability of community solar through the net present value (NPV) of a residential subscription, which measures the difference between the credits received and payments that subscribers make over time. A positive NPV means subscribers are saving money over the life of their subscription, as compared to not subscribing. The median capacity-weighted NPV of community solar subscriptions is about +$0.27 per watt (W-AC) through mid-2024.

Efforts Targeted at Low-Income Access to Community Solar
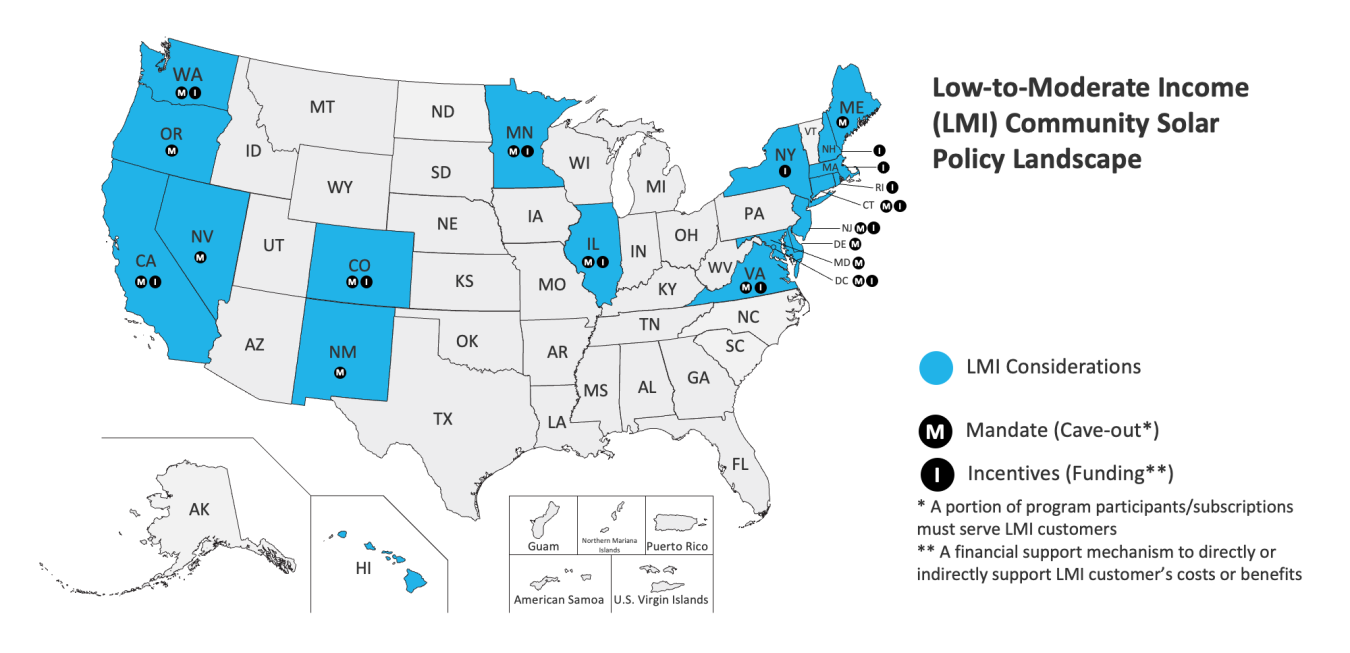
As of August 2024, 24 states and localities, including the District of Columbia, have enacted legislation that enables or requires community solar. Of that group, 20 have created provisions to address low-income participation in community solar. State government incentives provide additional funding for projects that subscribe low-income customers; some states have mandates called carve-outs that require a certain percentage of a community solar project or program to be subscribed by low-income subscribers or low-income serving organizations. Learn more about State Policies and Programs for Community Solar.


