
Since 2009, DOE has conducted research on the visual phenomenon commonly known as flicker. More formally called temporal light modulation (TLM), it is defined as rapid variation in light source intensity, which can cause visual effects ranging from uncomfortable or distracting to harmful or (rarely) dangerous. This has become a more serious consideration in the age of solid-state lighting (SSL) because LEDs and OLEDs are devices with little thermal or phosphor persistence, so there is a very rapid on or off response of the LED from the current delivered by the driver/dimmer electronics. Drivers for these devices can deliver current through an infinite variety of time-based waveforms, varying in shape, modulation depth, duty cycle, and frequency.
In the last 20 years, research and observation have shown us that if there is relative movement between the eye, head, lighted object, and the light source, TLM can be visible even at high frequencies of 1000, 2000, 6000 Hz, or even higher. In fact, under very dark conditions, some individuals can accurately identify the modulating source from a steady output source up to 11,000 Hz. It has also become clear that there is a wide individual variation in responses. Some can see “flicker” clearly under conditions where less sensitive individuals will see none at all. Are these sensitive observers the same people susceptible to migraines or other conditions? There is no conclusive answer from the neurology community as yet.
There are three established visual responses to TLM:
- Direct flicker is the perception of visual unsteadiness induced by a light stimulus where the luminance fluctuates with time, for a stationary observer with a fixed gaze.
- The stroboscopic effect is indirectly perceived and requires the movement of an object within the visual field, illuminated by the modulating light. As the object moves, its luminance varies, creating a discontinuous visual image of the object (see Figure 1 below).
- The phantom array effect involves the interaction of the observer’s visual saccade (rapid movement of the eye between fixation points) relative to the modulating light source, or an object lighted by it, and can produce a discrete set of dots or dashes or parallel edges on the retina (see Figure 2 below).
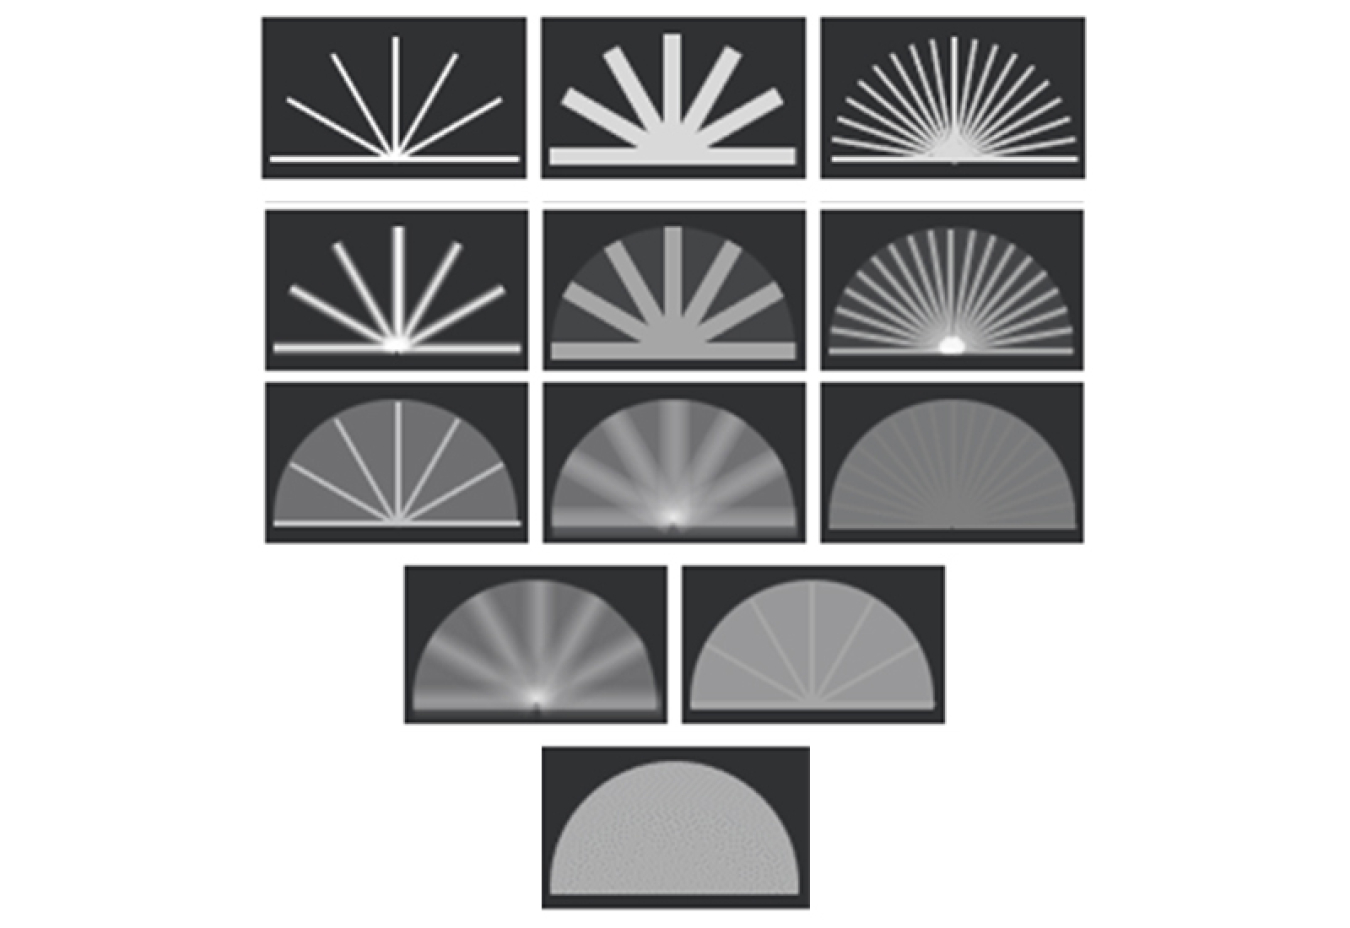
Figure 1: An illustration of the stroboscopic effect and what a waving wand might look like under different TLM waveforms. The top row is distinctly visible, the three rows in the middle are examples of partial pattern visibility, and the pattern in the bottom row is not at all visible. The appearance varies with wave shape, modulation, duty cycle, and frequency.
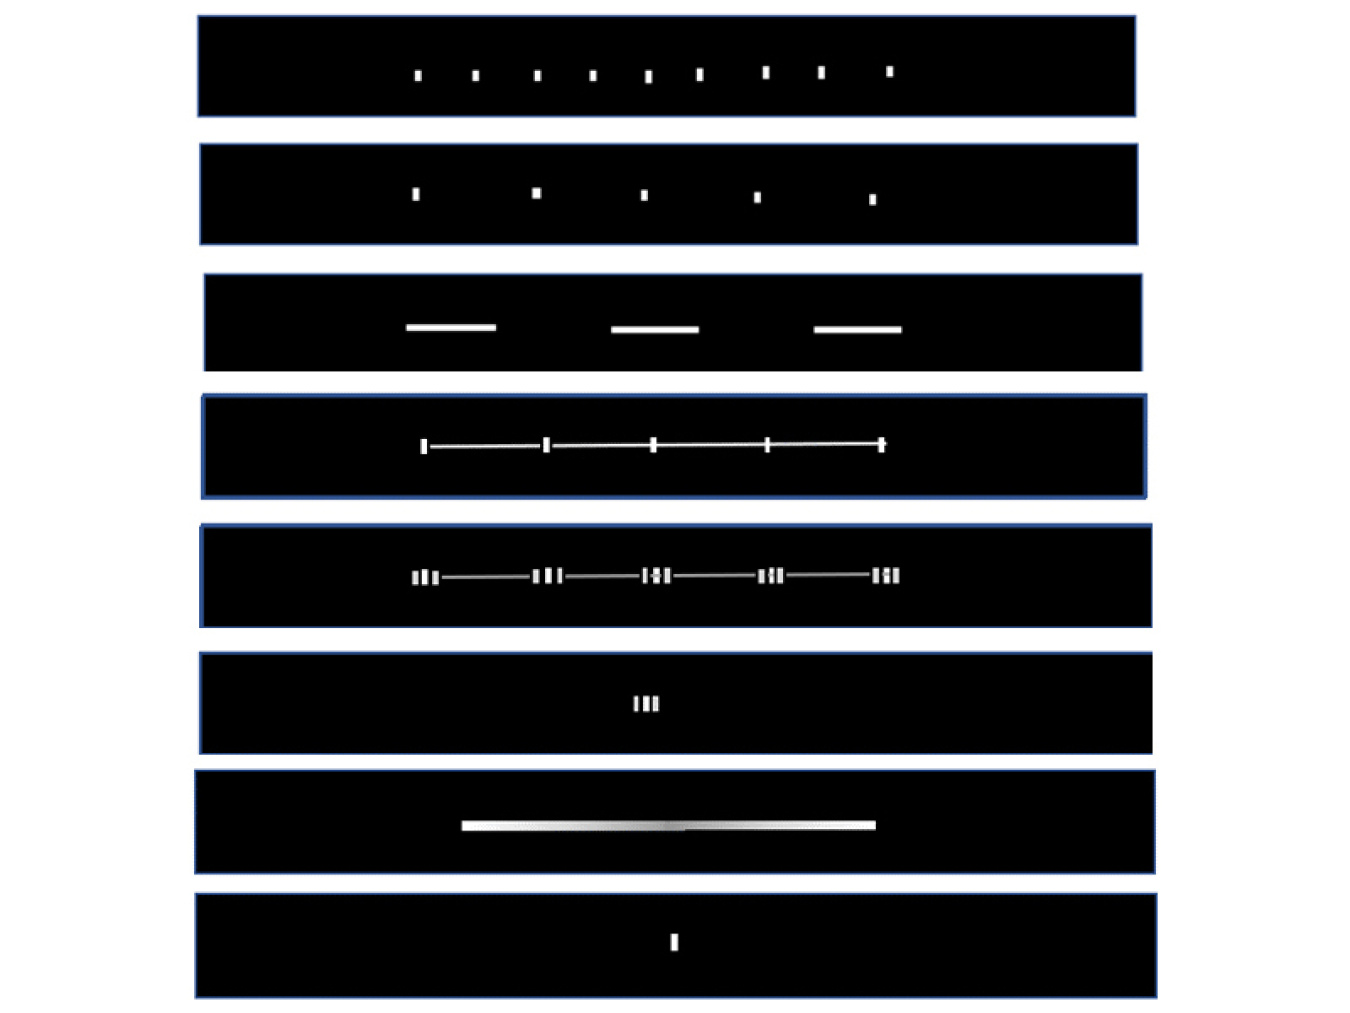
Figure 2: An illustration of the phantom array effect. The top three bars show a highly visible repeating pattern that varies with frequency, duty cycle, and 100% modulation. The middle group illustrates how the pattern might look when it is less conspicuous. The bottom pair of bars shows how it might appear when there is no pattern visible at all.
The scientific understanding of TLM is growing and evolving, and DOE provides analysis and technical support for various industry organizations working to develop improved test and measurement procedures to better characterize flicker. In addition, DOE research conducted by Pacific Northwest National Laboratory is advancing the science by accelerating our understanding of TLM waveforms that elicit visible responses, improving metrics that predict these responses from normal and sensitive populations, and encouraging the adoption of predictive metrics and appropriate test methods related to TLM.
An understanding of why flicker matters and how much it varies across commercially available products is essential to proper lighting design. Specifying the right product for a given application and sensitivity group requires the ability to quantitatively characterize flicker. A few of the most widely accepted metrics for quantifying a TLM waveform’s potential for eliciting a visual response include:
- For low-frequency direct flicker (generally cited as ranging from 3 to 80 Hz frequency): PstLM and the ASSIST’s MP.
- For stroboscopic motion in the field of view: stroboscopic visibility measure, SVM, which works for TLM waveforms roughly from 80 Hz up to about 1000 Hz.
- For frequencies at or above 500 Hz, the chief concern is seeing the repeating pattern of dots or dashes trailing the modulating light, the phantom array. At this point in time there is no standardized procedure for quantifying the phantom array effect from light sources.
Both the stroboscopic and phantom array effects are detectable at and below 80 Hz, but direct flicker dominates the concerns in that range. Similarly, direct flicker is visible below 3 Hz, but no health concerns have been observed, so 3 Hz is normally cited as the lower end of the range.
Because the metrics have been incomplete and insufficiently documented for usefulness and need, manufacturers of drivers rarely report flicker characteristics. Furthermore, there is testing complexity for the driver manufacturer because the current waveform delivered to the LED or OLED depends on the driver loading, the dimming level, and the waveform the dimmer delivers to the driver. This means that a single driver must be tested in multiple conditions for flicker performance.
No single metric can characterize performance and risk at all frequencies and for all applications. For example, a stroboscopic effect metric may predict visibility of the waveform for an average observer, but it cannot predict the response of a sensitive observer, or a video camera, or the interaction between moving machinery and modulating light. It often takes multiple metrics combined with knowing the fundamental frequency to identify potential products, and then a mockup to test for final acceptability. The only way to avoid this complication is to employ dimming and driver strategies such as high frequency (greater than 12,000 Hz and possibly higher) or waveforms that exhibit no pulse-width modulation (PWM) techniques that can result in deep oscillation of light output.
A test-and-measurement procedure is needed to facilitate the capture of light-source intensity or luminance over time in a waveform, that can in turn be analyzed mathematically or by an instrument to return flicker metric values. Currently, DOE contributes expertise and technical support on the following committees:
- Illuminating Engineering Society (IES) Testing Procedures Committee, Method of Measuring Optical Waveforms for Use in Temporal Light Artifact (TLA) Calculations. The committee published LM-90-2020, Measuring Luminous Flux Waveforms for Use in Temporal Light Artifact (TLA) Calculations.
- IES Vision Science Committee, working toward the quantification and specification of flicker.
- International Commission on Illumination (CIE) Technical Committee 1-83, Visual Aspects of Time-Modulated Lighting Systems. The committee has developed a standard for the visibility of the stroboscopic effect, just published as CIE 249-2022.
- CIE Technical Committee 2-89, which has developed standardized measurement procedures for the flicker waveform. The current recommendation is Technical Note 12, or TN12-2021.
The work of these committees is ongoing because the scientific understanding of perceptions of TLM is growing and evolving.
DOE research conducted by Pacific Northwest National Laboratory (PNNL) is focused on accelerating the understanding of TLM waveforms that elicit visible responses, improving metrics that predict these responses from normal and sensitive populations, and encouraging the adoption of predictive metrics and appropriate test methods related to TLM.
PNNL designed and implemented a human subjects experiment for exploring the visibility of the stroboscopic and phantom array effects from TLM waveforms above frequencies of 90 Hz. This work is filling in the gap of understanding in higher frequency responses (see figures below), which is likely applicable to automotive as well as architectural lighting, and will help to establish more effective specification criteria and provide guidance for product manufacturers.
Phantom Array and Stroboscopic Effect Visibility under Combinations of TLM Parameters (Journal article, June 2023)
This work will complement another study, conducted with the National Research Council of Canada, that will investigate the response of sensitive individuals under longer duration exposure to TLM in realistic environments.
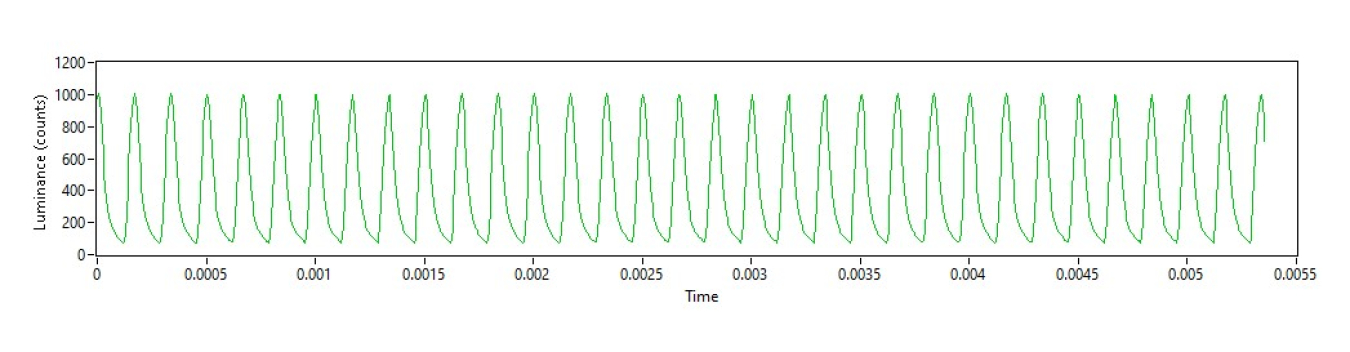
A 6000 Hz flicker waveform used in the PNNL human subjects flicker testing.
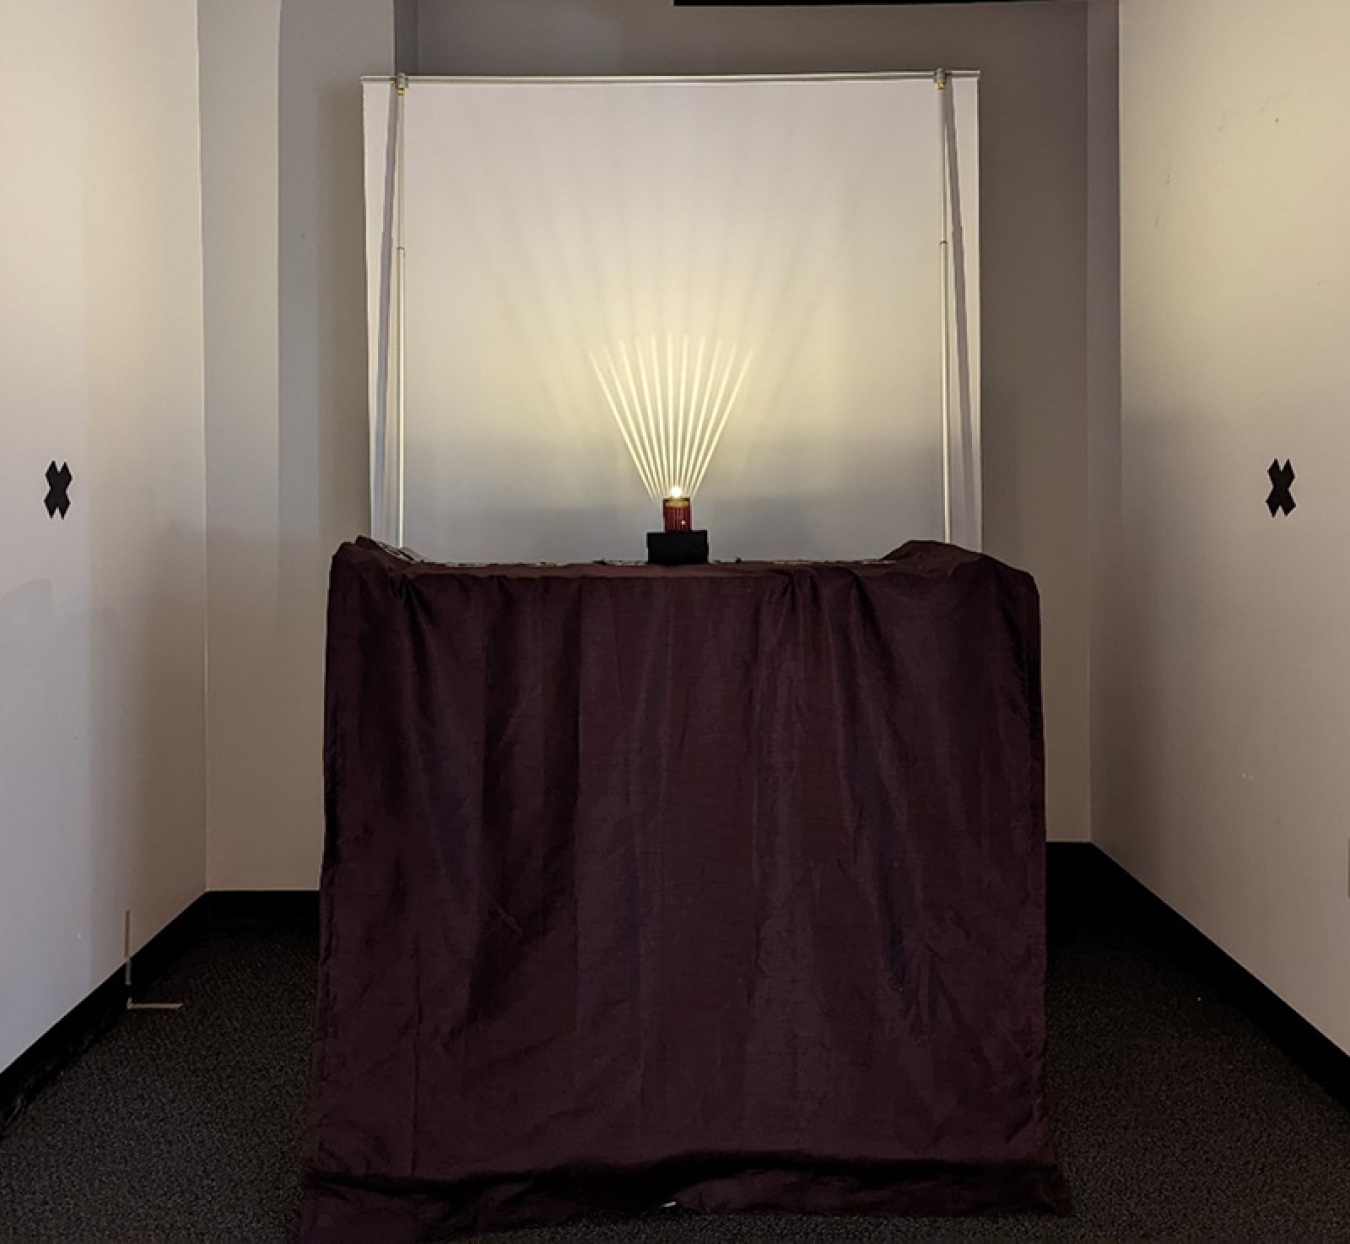
Photo of the experimental setup for human subjects testing at PNNL, showing a stroboscopic effect from a rotating wand.
As part of the effort to characterize the visibility of TLM, PNNL completed a literature review published in the journal Lighting Research & Technology.
Flicker: A Review of Temporal Light Modulation Stimulus, Responses, and Measures (Journal article, August 2022)
This article will be followed by another that examines calculation procedures for numerous existing metrics for assessing responses to TLM. Not all metrics are derived from waveforms in the same way, and there are surprising variations in calculated values due to waveform filtering steps, isolating cycles, and sampling rates. The intent of the article is to inform both IES and CIE testing committees so that procedures can be refined for evaluating waveforms consistently among laboratories.
PNNL researchers are also contributing to an IES document being developed by the Vision Science Committee that reviews existing literature on flicker perception and establishes a roadmap for the IES to recommend a method for evaluating flicker, along with associated specification criteria.
A number of handheld flicker meters, ranging from simple smartphone applications to scientific-grade meters, are available to help users determine in the field if flicker is occurring and, if so, whether the level is acceptable for the application in question. A DOE study documented the capabilities and accuracy of eight handheld meters, compared to a reference benchtop meter. An earlier study compared three benchtop laboratory meters against a reference system to evaluate their performance and accelerate development of standard test and measurement procedures.
Characterizing Photometric Flicker: Handheld Meters (Report, November 2018)
Characterizing Photometric Flicker (Report, February 2016)
The increased availability of more affordable and easier-to-use measurement devices indicates the growing awareness of flicker by lighting technology developers, and the improved ability to address it through emerging measurement methods and recommended practices.
Three DOE Solid-State Lighting videos featuring commentary by Naomi Miller of Pacific Northwest National Laboratory.
2019 Webinar: Metrics in Motion: Flicker & Glare
2018 Report: Characterizing Photometric Flicker: Handheld Meters
2016 Report: Characterizing Photometric Flicker
2015 CALiPER Report 22.1: Photoelectric Performance of LED MR16 Lamps
2014 CALiPER Report 20.2: Dimming, Flicker, and Power Quality Characteristics of LED PAR38 Lamps
2014 CALiPER Retail Lamps Study 3.1: Dimming, Flicker, and Power Quality Characteristics of LED A Lamps
2012 Presentation: LED Dimming: What You Need to Know
2014 Presentation: SSL Flicker Fundamentals and Why We Care
2015 Presentation: Flicker: Understanding the New IEEE Recommended Practice
IEEE Standard 1789-2015: IEEE Recommended Practices for Modulating Current in High-Brightness LEDs for Mitigating Health Risks to Viewers
1989 Journal Abstract: Fluorescent Lighting, Headaches and Eye-Strain
1995 Journal Article: Modulation of Fluorescent Light: Flicker Rate and Light Source Effects on Visual Performance and Visual Comfort
2018 Report: Visual Perception under Energy-Efficient Light Sources - Detection of the Stroboscopic Effect Under Low Levels of SVM
2012 Report: ASSIST Recommends… Flicker Parameters for Reducing Stroboscopic Effects from Solid-State Lighting Systems
2015 International Electrotechnical Commission Technical Report 61547-1: Equipment for General Lighting Purposes - EMC Immunity Requirements - Part 1: An Objective Voltage Fluctuation Immunity Test Method
2014 Presentation: Objective Testing of Flicker and Stroboscopic Effects Resulting from Mains Voltage Fluctuations
2014 Journal Article: Modeling the Visibility of the Stroboscopic Effect Occurring in Temporally Modulated Light Systems
2012 Journal Article: Risk assessment for LED lighting flicker