Each year, the United States Department of Energy’s Lawrence Livermore National Laboratory (LLNL) releases energy flow charts that illustrate the nation's consumption and sources of energy. The measurements are expressed in British Thermal Units (BTUs), a common unit of measurement for energy. A BTU is the amount of heat it takes to raise 1 pound (~1 pint) of water by 1 degree Fahrenheit. 3,412 BTUs is equivalent to 1 kilowatt-hour, which is the amount of energy it takes to light an efficient LED lightbulb for a week.
The latest energy flow chart shows in 2021, Americans used 97.3 quads (quadrillion BTU) of energy, which is 4.4 quads more than last year’s 92.9 quads, equivalent to a 5% increase from 2020. But, both 2020 and 2021 annual energy consumption totals are less than 2018 and 2019, where Americans used more than 100 quads per year.
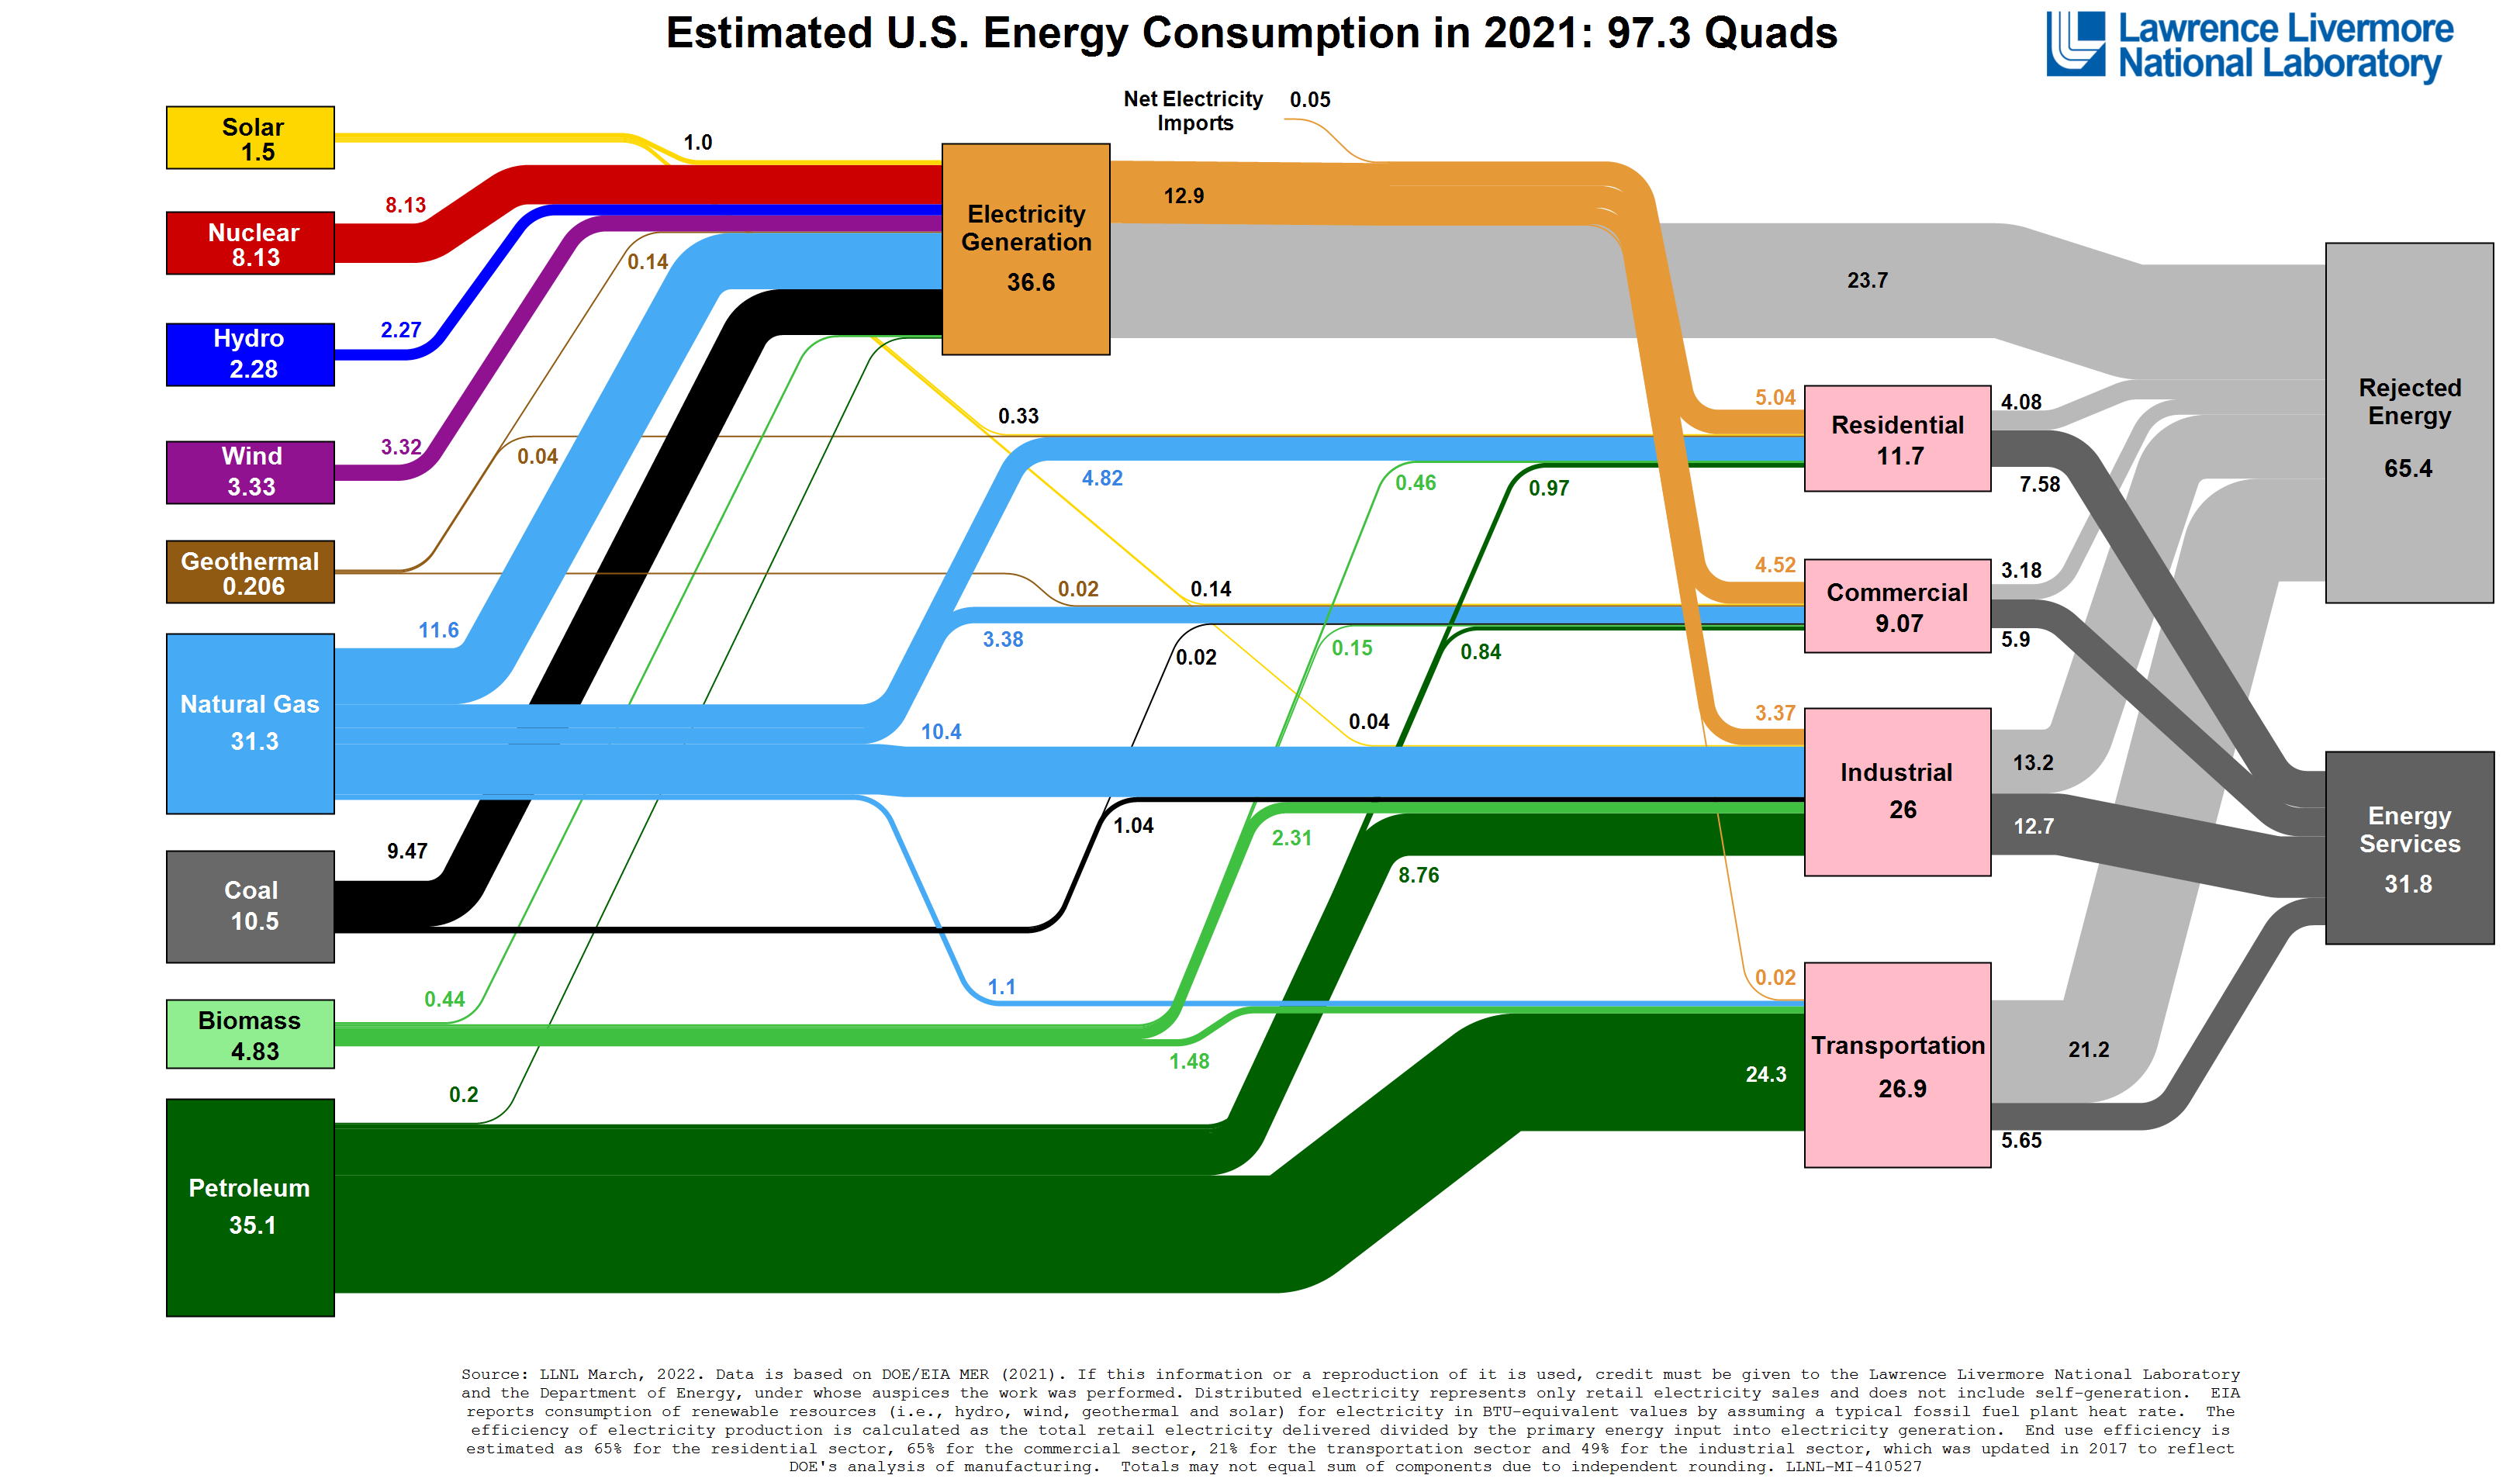
The largest increases in energy usage were from coal and petroleum, which increased by 14% and 9%, respectively. This change in coal-powered energy represents the first increase since 2014 and largest increase in over a decade. This increase is believed to be driven by increased natural gas prices in 2021. The increase in petroleum-powered energy was almost entirely (90%) driven by increases in the transportation sector to pre-pandemic levels.
Solar, wind, and biomass energy production increased drastically this past year, with jumps of 20%, 11%, and 7% respectively. These increases contrasted with hydro, geothermal and nuclear power, which decreased by 12%, 4% and 1%, respectively. The large drop in hydropower is due to exceptional drought conditions in the western United States. While hydroelectric power generation dominated the renewable energy sector for decades, solar and wind energy appear to be gaining a commanding lead — producing more than double the electricity of hydroelectric power in 2021.
The national energy flow chart is published alongside LLNL’s U.S. carbon flowchart for 2021.
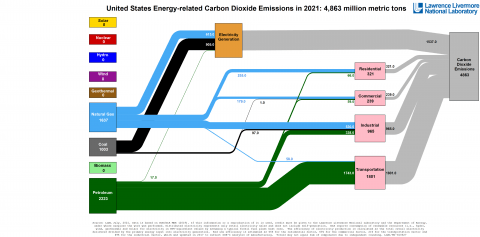
The carbon flow chart which show that national carbon dioxide (CO2) emissions increased from 4,555 to 4,863 million metric tons, indicative of a 7% increase. This increase is especially notable because, between 2019 and 2020, there was an 11% decrease in carbon dioxide emissions. This increase is a combined result of the increase in coal for electric coal generation and increases in the petroleum-based transportation sector.
Subscribe to receive updates from Energy Saver, including new blogs, updated content, and seasonal energy saving tips for consumers and homeowners.