
SUBSCRIBE to the Fact of the Week
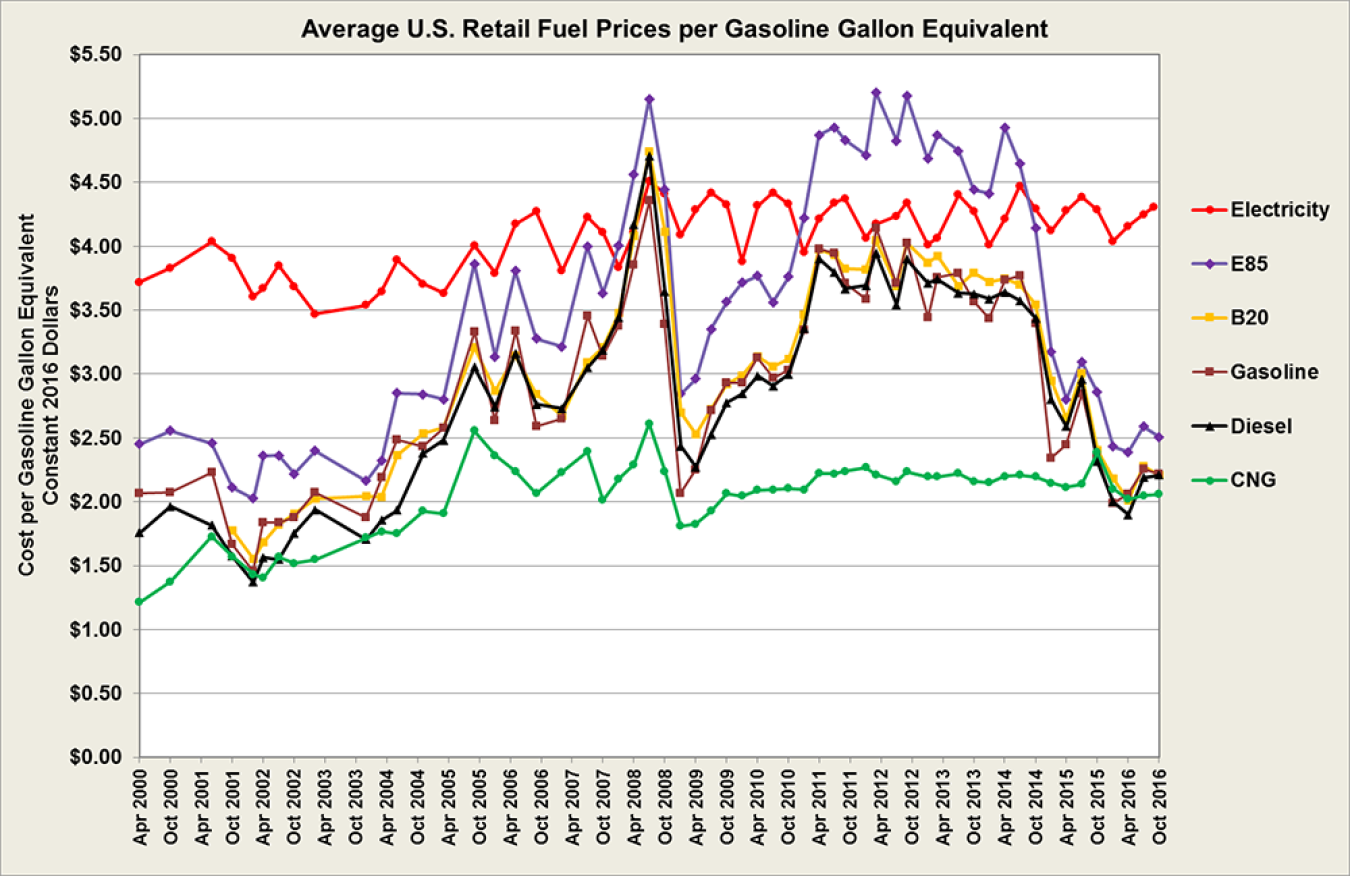
Retail prices for most transportation fuels have been highly volatile over the past 16 years. The prices are displayed in gasoline-gallon equivalents (GGE) which equate the energy content of any motor fuel to that of a gallon of gasoline. The prices are collected in gallons (except for CNG and electricity) and are converted to GGE. In this figure, the prices were also adjusted for inflation to 2016 dollars.
Since 2000, gasoline, diesel, propane, ethanol (E85), and biodiesel (B20) have all experienced significant fluctuations. Electricity prices show cyclical price variations from the summer months to the winter months. Over the 16-year period, electricity ranged from a low of $3.47 per GGE to a high of $4.51 per GGE, a $1.04 difference. In contrast, gasoline prices ranged from a low of $1.46 per GGE to a high of $4.36 per GGE, a $2.90 difference. Although CNG experienced larger price fluctuations between 2005 and 2009, the price was generally more stable from 2009-on.
Average U.S. Retail Fuel Prices per Gasoline Gallon Equivalent, Selected Dates from 2000 to 2016
Notes:
CNG = compressed natural gas.
E85 = 85% ethanol and 15% gasoline.
B20 = 20% biodiesel and 80% petroleum diesel.
Prices were adjusted for inflation using the quarterly Gross Domestic Product Implicit Price Deflator.
Supporting Information
| Survey Start Date | Gasoline | E85 | CNG | Diesel | B20 | Electricity |
|---|---|---|---|---|---|---|
| 4/10/2000 | $2.06 | $2.45 | $1.21 | $1.76 | Not available | $3.72 |
| 10/9/2000 | $2.07 | $2.56 | $1.37 | $1.96 | Not available | $3.83 |
| 6/4/2001 | $2.23 | $2.46 | $1.73 | $1.82 | Not available | $4.04 |
| 10/22/2001 | $1.67 | $2.11 | $1.57 | $1.57 | $1.78 | $3.91 |
| 2/11/2002 | $1.46 | $2.03 | $1.43 | $1.37 | $1.56 | $3.61 |
| 4/15/2002 | $1.84 | $2.36 | $1.40 | $1.56 | $1.68 | $3.67 |
| 7/22/2002 | $1.84 | $2.36 | $1.57 | $1.55 | $1.82 | $3.85 |
| 10/28/2002 | $1.87 | $2.22 | $1.52 | $1.75 | $1.90 | $3.69 |
| 2/3/2003 | $2.07 | $2.40 | $1.55 | $1.94 | $2.02 | $3.47 |
| 12/1/2003 | $1.88 | $2.16 | $1.72 | $1.70 | $2.04 | $3.54 |
| 3/3/2004 | $2.19 | $2.32 | $1.77 | $1.86 | $2.04 | $3.65 |
| 6/14/2004 | $2.48 | $2.85 | $1.75 | $1.93 | $2.36 | $3.89 |
| 11/15/2004 | $2.43 | $2.84 | $1.93 | $2.38 | $2.53 | $3.70 |
| 3/21/2005 | $2.58 | $2.80 | $1.91 | $2.48 | $2.58 | $3.63 |
| 9/1/2005 | $3.33 | $3.86 | $2.56 | $3.05 | $3.21 | $4.01 |
| 1/1/2006 | $2.64 | $3.13 | $2.36 | $2.74 | $2.87 | $3.79 |
| 5/24/2006 | $3.33 | $3.81 | $2.24 | $3.16 | $3.14 | $4.17 |
| 9/4/2006 | $2.59 | $3.28 | $2.06 | $2.76 | $2.84 | $4.27 |
| 2/21/2007 | $2.65 | $3.21 | $2.23 | $2.73 | $2.67 | $3.81 |
| 7/3/2007 | $3.45 | $4.00 | $2.39 | $3.05 | $3.09 | $4.23 |
| 10/2/2007 | $3.14 | $3.63 | $2.01 | $3.19 | $3.21 | $4.11 |
| 1/21/2008 | $3.37 | $4.01 | $2.18 | $3.44 | $3.48 | $3.84 |
| 4/1/2008 | $3.85 | $4.56 | $2.29 | $4.17 | $4.08 | $4.11 |
| 7/21/2008 | $4.36 | $5.15 | $2.61 | $4.71 | $4.74 | $4.51 |
| 10/2/2008 | $3.39 | $4.44 | $2.24 | $3.64 | $4.11 | $4.41 |
| 1/12/2009 | $2.07 | $2.84 | $1.81 | $2.43 | $2.70 | $4.09 |
| 4/1/2009 | $2.25 | $2.96 | $1.83 | $2.27 | $2.53 | $4.28 |
| 7/20/2009 | $2.72 | $3.35 | $1.93 | $2.53 | $2.73 | $4.42 |
| 10/16/2009 | $2.93 | $3.56 | $2.06 | $2.77 | $2.92 | $4.33 |
| 1/19/2010 | $2.93 | $3.72 | $2.05 | $2.84 | $2.99 | $3.88 |
| 4/2/2010 | $3.13 | $3.77 | $2.09 | $2.98 | $3.14 | $4.32 |
| 7/12/2010 | $2.97 | $3.56 | $2.09 | $2.90 | $3.06 | $4.42 |
| 10/4/2010 | $3.03 | $3.76 | $2.10 | $3.00 | $3.12 | $4.33 |
| 1/24/2011 | $3.34 | $4.22 | $2.10 | $3.35 | $3.46 | $3.95 |
| 4/1/2011 | $3.98 | $4.87 | $2.22 | $3.90 | $3.98 | $4.21 |
| 7/14/2011 | $3.94 | $4.93 | $2.22 | $3.79 | $3.93 | $4.34 |
| 9/30/2011 | $3.71 | $4.83 | $2.24 | $3.66 | $3.82 | $4.37 |
| 1/13/2012 | $3.59 | $4.71 | $2.27 | $3.69 | $3.82 | $4.07 |
| 3/30/2012 | $4.14 | $5.20 | $2.21 | $3.95 | $4.04 | $4.17 |
| 7/13/2012 | $3.71 | $4.83 | $2.16 | $3.54 | $3.69 | $4.24 |
| 9/28/2012 | $4.03 | $5.17 | $2.23 | $3.90 | $4.03 | $4.34 |
| 1/10/2013 | $3.44 | $4.68 | $2.20 | $3.71 | $3.87 | $4.01 |
| 3/29/2013 | $3.75 | $4.87 | $2.20 | $3.74 | $3.92 | $4.07 |
| 7/12/2013 | $3.79 | $4.74 | $2.22 | $3.63 | $3.69 | $4.40 |
| 10/4/2013 | $3.56 | $4.44 | $2.16 | $3.63 | $3.79 | $4.28 |
| 1/1/2014 | $3.43 | $4.41 | $2.15 | $3.59 | $3.72 | $4.01 |
| 4/1/2014 | $3.73 | $4.93 | $2.20 | $3.64 | $3.74 | $4.21 |
| 7/1/2014 | $3.77 | $4.64 | $2.21 | $3.57 | $3.70 | $4.47 |
| 10/1/2014 | $3.40 | $4.14 | $2.20 | $3.44 | $3.54 | $4.29 |
| 1/1/2015 | $2.34 | $3.17 | $2.15 | $2.80 | $2.95 | $4.12 |
| 4/1/2015 | $2.45 | $2.80 | $2.11 | $2.59 | $2.65 | $4.28 |
| 7/1/2015 | $2.84 | $3.10 | $2.14 | $2.95 | $3.00 | $4.39 |
| 10/1/2015 | $2.36 | $2.86 | $2.38 | $2.31 | $2.40 | $4.29 |
| 1/1/2016 | $1.99 | $2.43 | $2.10 | $2.00 | $2.18 | $4.04 |
| 4/1/2016 | $2.06 | $2.39 | $2.02 | $1.90 | $2.01 | $4.16 |
| 7/1/2016 | $2.26 | $2.59 | $2.05 | $2.19 | $2.28 | $4.25 |
| 10/1/2016 | $2.22 | $2.51 | $2.06 | $2.21 | $2.21 | $4.31 |
Notes:
Sources: | ||||||