
Despite a 124% increase in horsepower and 47% decrease in 0-60 time from 1980 to 2014, the fuel economy of vehicles improved 27%. All of these data series are sales-weighted averages. The weight of the vehicle appears to have an inverse relationship with fuel economy thus many manufacturers are working to reduce vehicle weight.
Characteristics of Light Vehicles Sold, Model Years 1980-2014
Image
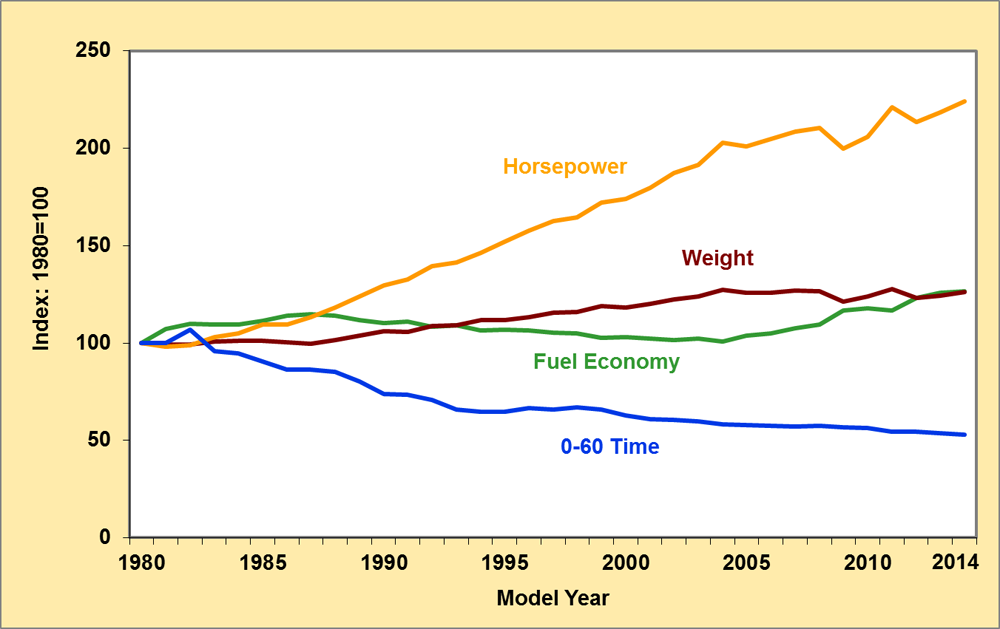
Note: Data are sales-weighted.
Supporting Information
| Model Year | Fuel Economy | Weight | Horsepower | 0-60 Time |
|---|---|---|---|---|
| 1980 | 100 | 100 | 100 | 100 |
| 1981 | 107 | 99 | 98 | 100 |
| 1982 | 110 | 99 | 99 | 107 |
| 1983 | 109 | 101 | 103 | 96 |
| 1984 | 110 | 101 | 105 | 95 |
| 1985 | 111 | 101 | 110 | 90 |
| 1986 | 114 | 100 | 110 | 86 |
| 1987 | 115 | 100 | 113 | 86 |
| 1988 | 114 | 102 | 118 | 85 |
| 1989 | 112 | 104 | 124 | 80 |
| 1990 | 110 | 106 | 130 | 74 |
| 1991 | 111 | 106 | 133 | 74 |
| 1992 | 108 | 109 | 139 | 71 |
| 1993 | 109 | 109 | 141 | 66 |
| 1994 | 106 | 112 | 146 | 65 |
| 1995 | 107 | 112 | 152 | 65 |
| 1996 | 107 | 113 | 158 | 66 |
| 1997 | 105 | 115 | 163 | 66 |
| 1998 | 105 | 116 | 164 | 67 |
| 1999 | 103 | 119 | 172 | 66 |
| 2000 | 103 | 118 | 174 | 63 |
| 2001 | 102 | 120 | 180 | 61 |
| 2002 | 102 | 122 | 188 | 61 |
| 2003 | 102 | 124 | 191 | 60 |
| 2004 | 101 | 127 | 203 | 58 |
| 2005 | 104 | 126 | 201 | 58 |
| 2006 | 105 | 126 | 205 | 57 |
| 2007 | 108 | 127 | 209 | 57 |
| 2008 | 109 | 127 | 211 | 57 |
| 2009 | 117 | 121 | 200 | 57 |
| 2010 | 118 | 124 | 206 | 56 |
| 2011 | 117 | 128 | 221 | 55 |
| 2012 | 123 | 123 | 213 | 55 |
| 2013 | 126 | 124 | 218 | 54 |
Source: Oak Ridge National Laboratory, 2014 Vehicle Technologies Market Report, ORNL/TM-2015/85, March 2015. | ||||