
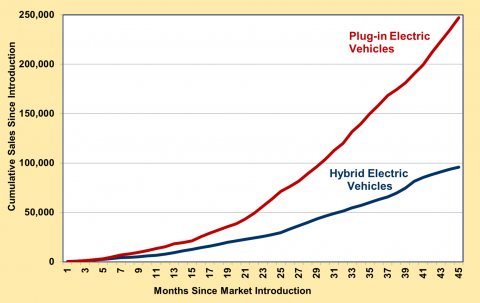
The first hybrid electric vehicle was introduced in December 1999 and for the next 45 months (through August 2003) there were a total of 95,778 hybrid vehicles sold. The first mass-marketed plug-in electric vehicles arrived in December 2010. By August 2014 (45 months later), cumulative sales of plug-in electric vehicles reached 247,188; that is two and one-half times more than hybrids at the same point in time after market introduction. It is noteworthy that the higher sales of plug-in electric vehicles came during a period of lower overall light vehicle sales. Following the economic recession, light vehicle sales reached just 12.5 million for 2011 and recovered to 15.3 million by 2013. During the 45 month introduction period of hybrid vehicles (December 1999-August 2003) overall light vehicle sales were about 17 million per year.
Cumulative Sales for Plug-in Electric Vehicles and Hybrid Electric Vehicles in the First 45 Months
Image

Notes:
- Month 1 for hybrid electric vehicle introduction is December 1999 and month 45 is August 2003.
- Month 1 for plug-in electric vehicle introduction is December 2010 and month 45 is August 2014.
- Plug-in Electric Vehicles include plug-in hybrid vehicles and all-electric vehicles.
- Hybrid Electric Vehicles derive all of their energy from gasoline and cannot be plugged into any outlet.
Supporting Information
| Months since Market Introduction | Plug-In Electric Vehicle Cumulative Sales | Hybrid Electric Vehicle Cumulative Sales |
|---|---|---|
| 1 | 345 | 17 |
| 2 | 769 | 568 |
| 3 | 1,133 | 1,129 |
| 4 | 2,039 | 1,800 |
| 5 | 3,105 | 2,460 |
| 6 | 4,736 | 3,437 |
| 7 | 7,005 | 4,158 |
| 8 | 8,062 | 4,666 |
| 9 | 9,727 | 5,228 |
| 10 | 11,481 | 5,904 |
| 11 | 13,455 | 6,667 |
| 12 | 15,367 | 7,947 |
| 13 | 18,108 | 9,367 |
| 14 | 19,535 | 10,959 |
| 15 | 21,197 | 12,497 |
| 16 | 25,358 | 14,299 |
| 17 | 28,953 | 15,744 |
| 18 | 32,331 | 17,773 |
| 19 | 35,649 | 19,746 |
| 20 | 38,665 | 21,106 |
| 21 | 43,409 | 22,722 |
| 22 | 49,218 | 24,135 |
| 23 | 56,450 | 25,728 |
| 24 | 63,608 | 27,550 |
| 25 | 71,277 | 29,649 |
| 26 | 76,003 | 33,306 |
| 27 | 81,458 | 36,375 |
| 28 | 89,090 | 39,805 |
| 29 | 96,228 | 43,356 |
| 30 | 103,982 | 46,370 |
| 31 | 112,724 | 49,018 |
| 32 | 120,166 | 51,384 |
| 33 | 131,529 | 54,527 |
| 34 | 139,656 | 56,972 |
| 35 | 149,756 | 59,919 |
| 36 | 158,589 | 62,895 |
| 37 | 168,379 | 65,691 |
| 38 | 174,284 | 69,477 |
| 39 | 181,329 | 74,744 |
| 40 | 190,501 | 81,636 |
| 41 | 199,406 | 85,254 |
| 42 | 211,859 | 88,431 |
| 43 | 223,352 | 91,071 |
| 44 | 234,785 | 93,614 |
| 45 | 247,188 | 95,778 |
Source: | ||