
DOE's SSL Program has released a report that estimates the installed stock, energy use, and lumen production of all general-illumination lighting products operating in the U.S. in 2015. The third such report issued by DOE since 2002, it provides a baseline that helps us plan our R&D program, and is used by both governmental and nongovernmental organizations for planning and evaluating lighting opportunities as well as additional research efforts. To give you some idea of how widely used these reports are, the last edition was downloaded well over 3,000 times.
The new U.S. Lighting Market Characterization (LMC) looks at four sectors: residential buildings, commercial buildings, industrial buildings, and outdoor. Its estimates were based on both public and confidential sources of information, including building-lighting audits, industry surveys, national lighting product shipment data, and interviews with lighting professionals and subject matter experts. Nearly 100 different organizations participated, making for a rich and robust data set — and showing just how much industry understands the value of building a unified and unbiased picture of the lighting market, which they can base their own planning on.
In 2015, U.S. lighting as a whole consumed 641 TWh of electricity, or approximately 17% of the country's total electricity use — equivalent to the total energy consumed that year by nearly 59 million homes. Approximately 37% of the lighting electricity was consumed in the commercial sector, which also produced the majority of lumens (45%). The outdoor sector was the second-largest lighting electricity consumer in 2015, at 32% of overall consumption, while the residential sector ranked third at 23%.
Overall, LED lighting penetration into all sectors has made significant strides since 2010, representing 8% of overall lighting inventory in 2015, vs. less than 1% in 2010. That's a good start, but it still leaves 92% using less-efficient technology. The outdoor sector ranks highest in LED penetration, at 23% of that sector's lighting inventory (up from 8% in 2010) — followed by the commercial (10%, up from 2%), residential (7%, up from less than 1%), and industrial (4%, up from less than 1%) sectors.
The new LMC shows other notable trends. The total number of installed lamps and luminaires grew from just under 7 billion in 2001 to over 8.2 billion in 2010, and then to 8.7 billion in 2015. Most of this growth occurred in the residential sector, primarily due to an increase in the number of households. But while the number of lighting products per household rose from 43 in 2001 to 51 in 2010, it was 52 in 2015, indicating a leveling-off.
There's been a continued push towards higher-efficacy lighting, which has decreased electricity consumption. Investment in energy-efficient technologies, federal and state lighting regulations, and public awareness campaigns have been effective in shifting the market towards lighting technologies (especially LED) that are more energy-efficient. Across all sectors, the lighting stock has become more efficient, with the average system efficacy of installed lighting increasing from 36 lm/W in 2001, to 40 lm/W in 2010, and now to 51 lm/W in 2015. This rise in efficacy is largely due to two major technology shifts. The first is a move in the residential sector from incandescent lamps (which decreased from 62% of the installed base in 2010 to 35% in 2015) to halogen lamps (which increased to 17% in 2015 from 4% in 2010), CFLs (33%, up from 23%), and LED lighting. The second is a move from T12 to T8 fluorescent lamps and LED lighting in the commercial, industrial, and outdoor sectors. Overall, average lighting efficacy in the U.S. has increased by more than 40% since 2001; and although installed inventory has steadily increased since then, these advancements in lighting efficacy are responsible for roughly 75% of the 120 TWh energy savings between 2001 and 2015. But there's still a long way to go to reach the DOE target of 218 lm/W for warm-white LED luminaires.
As was true in previous LMCs, the most inefficient lighting sector in 2015 was the residential sector. Despite their decreasing presence, incandescent lamps still account for more than one-third of all residential lighting inventory. The relatively high efficacies in the commercial and industrial sectors are the result of a reliance primarily on fluorescent and, to an increasing extent, LED technologies, which together account for between 89% and 94% of the lighting inventory in those two sectors. The outdoor sector is dominated by high-intensity discharge (HID), LED, and fluorescent technologies, which account for 41%, 23%, and 21% of the installed base, respectively. While the outdoor sector has a much higher concentration of HID lamps than other sectors, it also has the highest percentage of LED lighting, resulting in a sector-wide efficacy (80 lm/W) that's notably higher than the national average. But, again, this leaves much room for improvement.
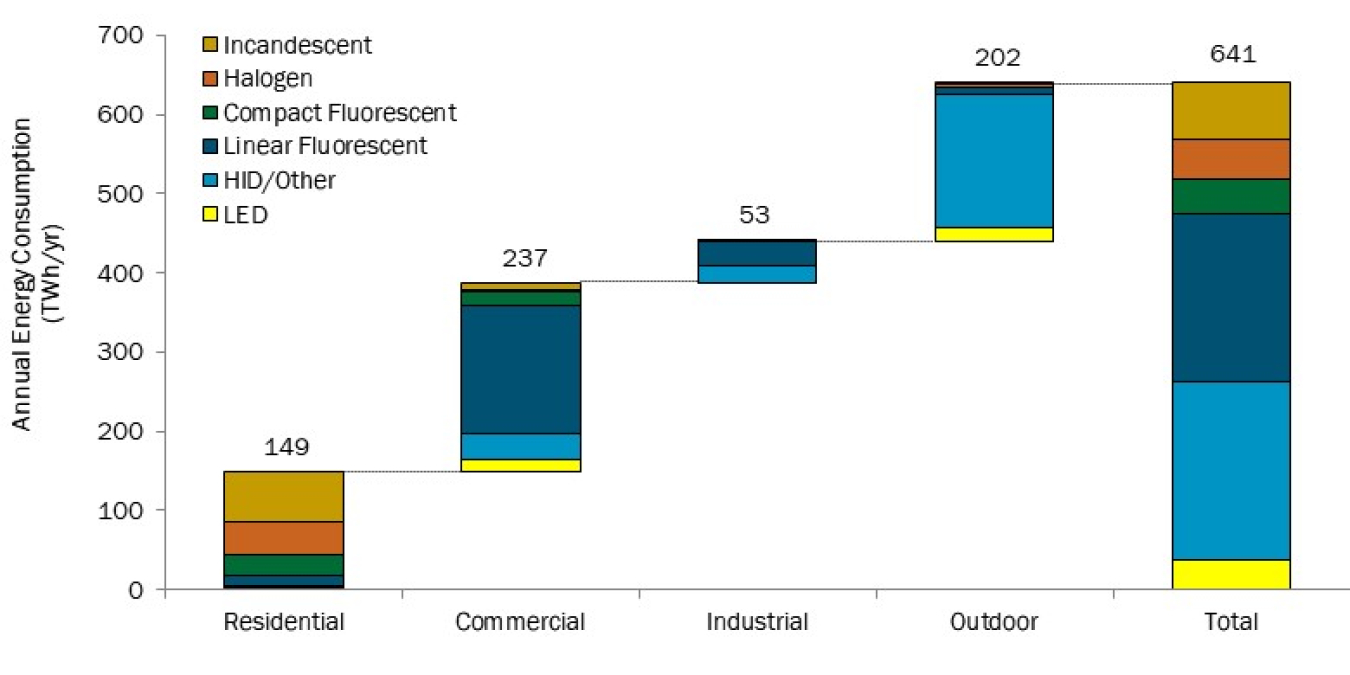
U.S. Lighting Electricity Consumption by Sector and Technology in 2015
Although the residential sector accounted for the overwhelming majority (71%) of installed lighting in the U.S. in 2015, it only consumed 149 TWh of electricity, or 23% of the national total, because it mainly uses low-lumen-output lighting products for relatively few hours per day. Largely due to longer operating hours, the commercial sector was the greatest energy consumer, as well as the sector in which the greatest number of lumens was produced -- which is why it's the main focus of the DOE SSL program. Both the industrial and outdoor sectors make up a relatively small portion of the total installed stock of lighting, each less than 3%. However, the use of high-lumen-output lighting products and high operating hours results in these sectors consuming proportionally greater shares of total electricity and producing proportionally more lumens.
While the overall findings of the new LMC are encouraging, they serve to underscore just how much remains to be done. Not just in terms of SSL adoption (still only 8% overall), which makes the energy savings possible, but also in terms of developing the technology so that those energy savings become magnified many times over.
For the complete results, download the full report.